Persistent racial inequality in the United States
3 A brief history of explicit racial discrimination, segregation, and disenfranchisement in the U.S.
- categorical inequality
- Inequality between particular social groups (identified, for instance, by a category such as race, nation, caste, gender or religion). Also known as: group inequality.
Figure 1 showed that racial differences in wealth and income have fallen over time but are still a long way from disappearing, and there has been little progress in many respects since the 1970s. However, the U.S. economy has grown by roughly 2% per year on average for the last 200 years. Modern capitalist growth generates perpetual change and innovation, with new goods, services, and jobs every generation. How, then, can a society have both persistent economic growth and persistent categorical inequality? To answer these questions, we need to understand the historical roots of racial inequalities.
Racial inequalities in the U.S. originate from slavery and the colonization of the New World. The U.S. was colonized during the peak of the Atlantic slave trade and enslaved Africans composed roughly one-third of the early American population. While there was a wide variety of regionally specific practices, enslaved people were generally denied access to education and were subject to capricious violence and sexual assault, and slave trading resulted in widespread family separations. Slavery gave rise to a legal structure identifying enslaved people as property and a racial ideology justifying unequal treatment, which long outlasted slavery itself.
The U.S. Civil War lasted from 1861 to 1865 and the abolition of slavery in 1865 marked an end to the starkest form of institutionalized discrimination but left a Black population that, while free from legal bondage, faced considerable discrimination and economic hardship.
Reconstruction
Economists have studied how the abolition of slavery affected slaveholders’ children and grandchildren. Among White people with ancestors of similar wealth, having a slave-owning parent or grandparent in 1860 had few negative effects in 1900. The descendants of slave owners retained access to education, political rights, and social networks that gave them the tools to recover their ancestors’ relative economic standing.
The Reconstruction era, which lasted from approximately 1865 to 1877, was a political effort following the end of the Civil War to address post-slavery inequalities, rebuild the South, and reunite the country. However, the pre-Civil War South was politically and economically dominated by a relatively small group of wealthy plantation and business owners, whose wealth and power were threatened by the prospect of Black economic and political rights. Despite a brief flourishing of Black political and economic power, there was harsh resistance by Southern White people especially and Reconstruction efforts failed to create lasting change or meaningful political protections for recently freed Black people.
Land Acts were a series of laws passed by Congress in the nineteenth century that allowed individuals to either buy land from the federal government or earn it through military service.
The denial of basic civil and political rights ensured that Black people were vulnerable to violence and exploitation and that policies that could address racial inequality were never realized. With no reliable way to press their interests in government or the courts, Black people were systematically excluded from a variety of important government programs and public goods. While White Southerners were able to gain land via Land Acts, public land sales, and lotteries for land taken from Native American tribes, Black people had no share in this wealth redistribution.
- vigilante violence
- Violence inflicted on others by private individuals who claim to be enforcing local social norms or laws, thereby taking law enforcement into private hands.
Many forms of power were deployed to ensure White dominance and control. Vigilante violence, which, unlike criminal violence, is tacitly supported by (and often involves the participation of) law enforcement, was instrumental in ending Reconstruction, reinforcing White rule, and limiting Black economic growth. As Charles E. Cobb Jr, the historian, writes, “Reconstruction did not fail; it was destroyed, crushed by more than a decade of savage campaigns of violence carried out both by the local governments that had remained intact and by vigilante terrorists. Lynchings and other forms of mob violence were the instruments of Reconstruction’s brutal death.”1
In his monumental study, Black Reconstruction in America, W. E. B. Du Bois, the sociologist, summarized the tragedy of Reconstruction with the famous line, “The slave went free; stood a brief moment in the sun; then moved back again toward slavery.” Employing violence, intimidation, nominally race-neutral legislation, discriminatory enforcement, and exploitation of the economically precarious position of newly freed Black people, White people were able to swiftly regain control of Southern institutions.
Jim Crow laws
The Jim Crow regime was a set of laws and social norms that institutionalized racial discrimination and segregation. Most Jim Crow laws were passed in the South prior to 1900, while outside the South the majority were passed after 1900. These laws lasted from roughly the end of the Civil War until 1968 when the legislative achievements of the Civil Rights Movement brought the Jim Crow era to a close.
Jim Crow laws were the primary means for White people to recreate the pre-Civil War economic and racial hierarchy. Approximately 290 laws were passed by states between 1870 and 1940, imposing segregation in education, voting, and public accommodations.
The segregation and strict hierarchy this created impacted every aspect of life. With segregated schools, hospitals, libraries, buses, restaurants, and other facilities, Black people living in the same cities and towns as White people had access to far fewer resources, opportunities, and consumer choices. According to Adolph Reed Jr, the historian: “The point was not to remove [Black people] from the mainstream economy but to enforce their subordinate position within it.”2
Latimer, Morgan, and Woods were all important Black inventors. Latimer helped develop the telephone and made important contributions to commercial lighting. Morgan made improvements to traffic signals, created an early version of a gas mask, and invented a hair straightening product. Woods held more than 50 patents, was the first Black mechanical and electrical engineer after the Civil War, and did important work on trains and streetcars.
One example of the disruption caused by Jim Crow laws was the segregation of social networks related to invention. Fairs, where information was exchanged and social and financial connections were made, were critical for bringing inventions to market. During this period, Black inventors were not able to fully participate in the fairs and were confined to “Negro days” or “Negro buildings.” This lack of access to networks made it more difficult to build and earn wealth from one’s creations.3 Even Black “great inventors,” such as Lewis Latimer, Garrett Morgan, and Granville T. Woods, were subjected to this lack of access.
Another example is anti-miscegenation laws, which prohibited cross-race marriages, and worked alongside strong, violently enforced social norms against cross-race relationships. These laws and norms helped ensure that marriages and partnerships would be racially segregated, and so racial categorization would be transmitted intergenerationally.
Sharecropping was a practice in which a landlord would allow tenants to use their land in return for a share of the harvest (or crop) they produced. In the U.S. South, sharecroppers’ labor market competition and mobility were severely limited. For example, “anti-enticement” laws, similar to “non-compete” clauses in today’s labor contracts that prohibit employees from quitting and working for any of their employer’s competitors, limited sharecroppers’ options and thus their bargaining power. However, some sharecroppers were able to save enough of their income to buy their own land, contributing to the convergence in the Black–White wealth gap seen in the introduction.
Jim Crow laws also severely limited geographic mobility. This limited mobility, combined with low levels of income and wealth, made it difficult for Black people to move out of the South for many decades. After the Civil War, the economies of the South and North diverged sharply: while the North enjoyed the emergence of a booming manufacturing sector, the South was still largely dependent on agriculture. In 1900, the average income in the South was only half that of the national average. Newly freed Black people largely ended up living in the cotton-growing regions of the South, often as sharecroppers and were thus disproportionately harmed by the relatively weak Southern economy.
Jim Crow laws also affected educational outcomes. Education in the South was segregated and differentially funded, leaving the majority of the Black population attending schools that were underfunded, both relative to the nation as a whole and relative to schools for White students. Black Southerners were thus prevented from developing economically useful skills and knowledge, compared to White people and Black Northerners.
A poll tax (also called a “head tax”) is levied on all adults. In many U.S. states, showing evidence of having paid the poll tax was required for voting, making voting very costly for the poor.
Furthermore, the end of Reconstruction and the rise of Jim Crow restrictions on Black voting signaled the end of Black political participation in the South. Subsequent laws on labor mobility, wages, and workers’ rights were thus crafted in non-democratic processes. Part of what enabled racial discrimination to persist was racially targeted restrictions on the right to vote—most notably poll taxes (taxes to be paid in order to be eligible to vote) and literacy tests—which rendered the U.S. a very limited democracy at best until the 1960s. Despite making up a significant proportion of the South’s population in the early twentieth century, Black communities had no formal political power due to disenfranchisement and voter intimidation. Without the power of the ballot box, Black Southerners remained subjected to overtly racist policies that constrained their economic opportunities.
The Tulsa Race Massacre and other violence
Violence against Black communities continued long after Reconstruction. Lynching was tolerated, and even encouraged, by the culture prevailing in the South, and ideologies encouraging such violence spread throughout the country.
To find out more about what happened during the Tulsa Race Massacre, read this New York Times article.
This violence also extended to mob attacks on economically successful Black communities, the most infamous case being the destruction of the prosperous Black Greenwood community known as America’s “Black Wall Street” during the Tulsa Race Massacre in 1921. White mobs, many of whom had been given weapons by the city, attacked the prosperous Black neighborhood following an alleged attack on a White teenager by a Black teenager. Over 35 square blocks were burned, likely between 100 and 300 people were killed, more than 800 were hospitalized due to injuries, 8,000 to 10,000 were left homeless, and more than 6,000 Greenwood residents were eventually detained in internment camps.
Violence against Black people that resulted in devalued, destroyed, or confiscated property was commonplace and widespread. It was also used to drive Black people entirely out of some towns, leading to many all-White “sundown towns,” where Black people were either formally or informally unwelcome after dark. Similarly, in large cities, violence by White gangs was often used to maintain strict racial boundaries between neighborhoods.
The New Deal and postwar policies
Between 1916 and 1970, opportunities to move out of the South opened up. Approximately six million Black Southerners moved to the North, usually to large urban areas, in what is now known as the Great Migration. This massive departure from the South, unfortunately, did not protect Black people from discrimination or segregation, which persisted across the country.
White politicians committed to segregation thwarted efforts designed to mitigate racial segregation and inequality, such as the building of the model city Soul City, NC, which attempted to attract Black people from poor and segregated urban areas in the North. Black people were also mostly excluded from New Deal and World War II public policies, which were largely responsible for creating a White American middle class. Since President Roosevelt needed support from Southern Senators to pass New Deal legislation, the compromise was to ensure that New Deal programs did not seriously threaten Jim Crow institutions. Ira Katznelson, the historian, has thus described these New Deal and postwar policies as “affirmative action for Whites.”4
The Servicemen’s Readjustment Act of 1944 (also known as the G.I. Bill) was one example of a federal policy that helped the growth of a White middle class while mostly excluding Black people. The G.I. Bill provided benefits to many veterans returning from World War II, including healthcare, affordable access to skills training and higher education, and loans to help in the purchasing of a house. While the G.I. Bill did result in some educational advances for Black people, most American colleges and universities were closed to them or open only to a few Black students. This limited the ability of historically Black colleges and universities (HBCUs) to accommodate the education and housing needs of Black veterans.
The creation of the Federal Housing Administration (FHA) in 1934 was another example. During the Great Depression, the FHA aimed to bolster the economy through increased homeownership by providing government insurance for mortgages, ushering in the modern mortgage system of low-interest rates and small down payments.
The policies that determined eligibility for FHA loans disadvantaged Black people because they drew heavily on the racial prejudices which were prevalent in the real estate industry at the time. For example, properties within a given neighborhood had to be occupied by the same social and racial classes to avoid instability and a reduction in housing values. Existing creditworthy (mostly White) neighborhoods that wanted financial assistance from the FHA were thus encouraged to erect restrictive barriers to prevent Black people from entering and/or limit their proximity to Black neighborhoods. Meanwhile, current or prospective residents of Black neighborhoods could rarely get such loans, which meant higher interest rates, higher down payments, and thus high debt levels for Black homeowners.
In contrast to aspiring Black homebuyers, these New Deal programs were a huge opportunity for White households to build wealth through homeownership. Like the G.I. Bill in education, FHA-backed mortgages and loans allowed many White families to move from urban areas into new single-family homes in the suburbs, a phenomenon now known as “White flight.”
- redlining
- The practice of denying housing loans, or only offering unduly expensive loans, for houses in certain neighborhoods, regardless of how creditworthy the borrowers are.
Figure 3 shows the racial disparities in creditworthiness and access to FHA-backed mortgages, based on maps drawn by the FHA and the Home Owners’ Loan Corporation (HOLC), another New Deal agency. Aside from average income, unemployment rates, and the condition of houses, race was an important factor determining creditworthiness. Neighborhoods which were majority Black (or trending in that direction) were given the lowest rating, the color red. This process of excluding whole neighborhoods from affordable home financing options due to their racial composition is thus known as redlining.
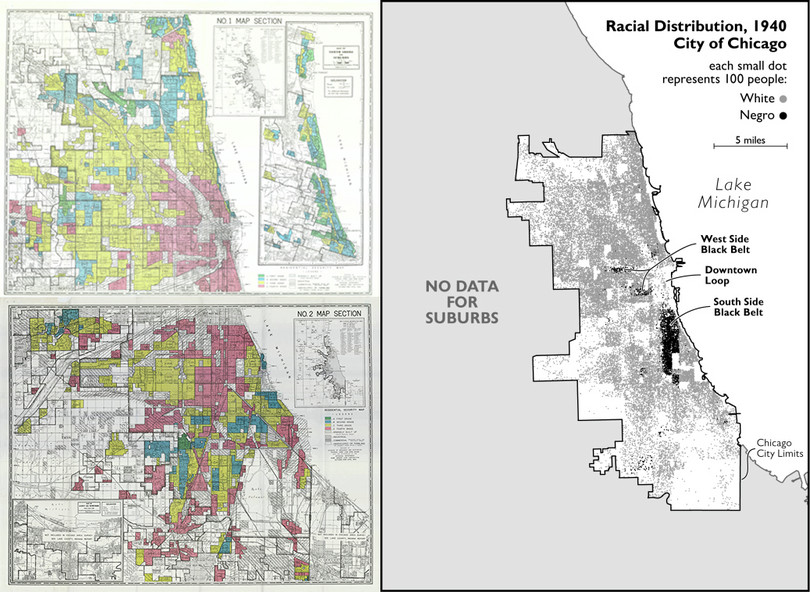
Figure 3 Two maps of Chicago. On the left, we have the HOLC appraisal map, and on the right, we have a map showing where the Black population of Chicago lived in 1940.
University of Richmond’s Digital Scholarship Lab. 2022. “Mapping Inequality”.. Updated 15 June 2022; Radical Cartography. 2022. “Racial Distribution, 1940. City of Chicago”. Updated 15 June 2022.
The process of redlining followed Black families and communities wherever they went. Their mere presence in a neighborhood downgraded the credit rating in the eyes of realtors, White neighbors, banks, and government agencies. It also indirectly led to widespread discriminatory practices by White realtors, such as contract buying, where realtors would not give ownership rights to Black buyers until the entire mortgage was paid off. These Black homeowners thus could not use their housing wealth to secure credit and, worse, were far more vulnerable to eviction.
It was not until 1968, with the passage of the Fair Housing Act, that racial discrimination in the rental or sale of housing was prohibited. Mortgage discrimination, however, was legal until 1974, and redlining was not barred until 1977. Exercise 4 (Section 4) invites you to compare the map of historical redlining and contemporary racial composition for a city of your choice.
The Civil Rights Movement
The Civil Rights Movement was a mass social movement in America during the 1950s and 1960s that fought against institutional racial discrimination, disenfranchisement, and segregation.
A few key milestones of the movement are:
- disparate impact
- Occurs when policies, practices, or other institutions that appear to be broadly neutral nonetheless have a disproportionate impact on a group or groups, specifically groups that have historically been oppressed, marginalized, or heavily discriminated against.
- The Supreme Court Decision in Brown v Board of Education in 1954, which found imposed racial segregation in schooling to be unconstitutional, and the follow-up decision in 1955 which ordered states to desegregate schools “with all deliberate speed.”
- The Civil Rights Act of 1964, which outlawed discrimination based on race, religion, sex, and national origin across society, with specific sections of the bill targeting racial discrimination and segregation in voter registration, public accommodations, public schools, and employment.
- The Voting Rights Act of 1965, which prohibited racial discrimination in voting and contained numerous provisions to enforce the voting rights contained in the constitution.
- The Civil Rights Act of 1968, which extended many constitutional protections to Native Americans, and also contained what is commonly known as the Fair Housing Act, which barred discrimination in the housing and rental markets.
- Loving v Virginia, a Supreme Court decision of 1967 that found laws banning cross-race marriage unconstitutional.
- Griggs v Duke Power Company, a Supreme Court decision of 1971 that found disparate impact discrimination by employers to be illegal under the provisions of the Civil Rights Act of 1964.
Although these Supreme Court decisions and acts of Congress applied to the entire nation, progress was most dramatically felt in the South, which finally saw the end of the Jim Crow regime and a surge in Black voter registration and formal political participation. Figure 4 shows how these changes resulted in broad gains in wellbeing, particularly for Black Southerners, who were initially much poorer than Black people in other U.S. regions.

Figure 4 On the left is the life expectancy at birth in the U.S. by race. On the right is the median Black male income by geographic region, showing a convergence between the South and other parts of the country starting in 1960.
Centers for Disease Control and Prevention. 2019. “National Center for Health Statistics”; Gavin Wright. 2013. Sharing the Prize. Harvard University Press.
Other notable improvements due at least in part to the efforts of the Civil Rights Movement include:
- Rising approval rates for Black–White marriages, as recorded by polls. Whereas in 1969, only 17% of White people and 56% of Black people approved of Black–White marriage, by 2021, 94% of the U.S. population approved of Black–White marriages.5
- A sharp decline in the Black infant mortality rate from 1965 to 1975, especially in the rural South, which saw a fall of infant mortality from about 4.5 infant deaths per 100 births to about 2.5 per 100.6
- Poverty rates in the South fell from 35.6% in 1960 to 16.4% in 2010, which was the largest regional decrease in the nation over that time period.7
- In 1960, high school graduation rates were 21.5 percentage points higher for White people compared to Black people. In 2021, the difference was only 4.3 percentage points.8
- Increased Black representation in government. For example, in 1965, there were five Black members of the House of Representatives, no Black senators, and no Black governors. By 2021, there were 57 Black members in the House (roughly on par with the percentage of Americans that are Black), three Black senators, and no Black governors.9
The Civil Rights Movement undoubtedly led to substantial improvements for the Black community. However, we saw in Figure 1 that although the wealth gap declined during the 1960s, it subsequently flattened out and has even risen in recent decades. Various forces which have led to increases in inequality generally over the past 50 years have also served to increase between-group inequality (for example, Black–White income gaps and wealth gaps).
Having discussed the ways that past policies and behavior explicitly stymied Black economic mobility, we now examine how current policies and norms explicitly or inadvertently do the same. This will provide a basis both for modeling these persistent inequalities and for understanding how to craft policies to reduce them.
-
Charles E. Cobb. 2014. This Nonviolent Stuff’ll Get You Killed: How Guns Made the Civil Rights Movement Possible. New York, NY: Basic Books. ↩
-
Adolph L. Reed Jr. 2022. The South: Jim Crow and Its Afterlives. New York, NY: Verso Books. ↩
-
Lisa D. Cook. 2014. Violence and economic activity: evidence from African American patents, 1870–1940. Journal of Economic Growth 19 (2): pp. 221–257. ↩
-
Ira Katznelson. 2005. When affirmative action was white: An untold history of racial inequality in twentieth-century America. New York, NY: WW Norton & Company. ↩
-
Justin McCarthy. 2021. “U.S. Approval of Interracial Marriage at New High of 94%”. Gallup, 10 September. ↩
-
Kenneth Y. Chay and Michael Greenstone. 2000. “The convergence in black-white infant mortality rates during the 1960’s”. American Economic Review 90(2): pp. 326–332. ↩
-
Jens Manual Krogstad. 2015. “How the geography of U.S. poverty has shifted since 1960”. 10 September. ↩
-
National Center for Education Statistics. 2022. ‘Rates of high school completion and bachelor’s degree attainment among persons age 25 and over, by race/ethnicity and sex: Selected years, 1910 through 2021’. Updated 5 October 2022. ↩
-
Anna Brown and Sara Atske, 2021. ‘Black Americans Have Made Gains in U.S. Political Leadership, but Gaps Remain’. Pew Research Center. Updated 27 January 2021. ↩
