Vulnerability to poverty: Public, private, and community responses
3 Income generation and vulnerability to poverty: From concepts to measurement
- vulnerability to poverty
- The likelihood that a household currently above the poverty line may fall into poverty in the future as a result of adverse events such as income loss, unemployment, illness, or price shocks. It captures a household’s exposure to risks and its limited capacity to cope with them, emphasizing that well-being depends not only on current income but also on economic security over time.
Vulnerability to poverty refers to the risk that individuals or households face of falling into poverty due to an adverse income shock. This vulnerability can be caused by a lack of resources and endowments, including physical and financial capital, making it difficult for individuals to cope with unexpected events that can lead to poverty. Factors that affect an individual’s risk of vulnerability can be individual-level or structural-level, and include:
- Income and assets: Households with lower incomes and fewer assets are more likely to be vulnerable to poverty. A fragile labour income or the absence of a stock of durable goods or monetary wealth limits a household’s ability to respond to economic fluctuations or natural disasters.
- Education and employment: Households with lower levels of education and fewer labour market skills are more exposed to poverty risks because they often work in unstable or low-paid jobs. Education helps reduce this vulnerability by opening access to better and more secure employment opportunities. It also gives individuals the ability to adapt to changes in the economy—such as technological progress or economic downturns—making it easier for their households to maintain a stable income and living conditions over time.
- Physical exposure to natural disasters or stresses: Households more exposed to shocks and stresses, such as natural disasters, war, or job loss, are more likely to fall into poverty. For example, households living in areas without proper infrastructure or with undefined land ownership rights may lose their shelter and become vulnerable to natural disasters. An example of these were the floods seen in Pakistan in 2022 that affected 33 million people (predominantly those in rural areas), with more than 1,700 deaths and economic damages of 14.9 billion USD, and an additional 16.3 billion USD needed to rebuild the country.1
- Social protection: Households with access to social protection programmes, such as health or job insurance systems, are less likely to be vulnerable to poverty. Without social security, losing a job can mean zero income for a household, with no way to cushion the economic impact.
- Coping mechanisms: Households equipped with robust coping mechanisms, such as savings or community-based networks, have a better chance of avoiding poverty or recovering from it. For example, households with savings can use them to cover unexpected expenses, such as a medical emergency or a job loss. Community-based mechanisms are especially important if state support is weak.
Measuring vulnerability to poverty
To measure vulnerability to poverty, we use levels of monetary income per capita. Vulnerability to poverty can be measured in other ways, like availability of insurance or financial services. Aside from using income distributions, a common approach is to use the poverty vulnerability index.2 This index measures the probability that a household will fall into poverty over time. It is based on multiple factors, including income, expenditure, assets, and education.
Figure 5 illustrates the income distribution in Colombia in 2023, as an example of a country with a high incidence of vulnerability. On the horizontal axis, the per capita income levels of all individuals in this population are arranged in ascending order (from lowest to highest). Per capita income refers to the average income per household member, calculated by dividing the total household income by the number of household members. This measure is preferred for comparative purposes because it reflects the income available for expenditure by each household member.
For instance, consider a household comprising a young adult couple earning a combined total of $2,000 per month, resulting in an available income of $1,000 per person. In contrast, if another household has a single income earner earning the same $2,000 but supporting two dependent children, the available income per household member is less than $700. The per capita income in the first household is nearly 40% higher than in the second household.
The vertical axis measures the cumulative proportion of the population up to the corresponding per capita income level, on the horizontal axis. For every horizontal axis value, the corresponding level on the vertical axis represents the percentage of the population that has a per capita income less than or equal to that value.

Figure 5 Four income groups: extreme poverty, poverty, vulnerable, and the middle/upper class.
The authors’ own calculation based on the National Statistics Department (DANE) Gran Encuesta Integrada de Hogares (National household income survey) 2023.
Separating these four income groups are three threshold levels of per capita income that are relevant to understanding vulnerability to poverty, the extreme poverty line, the poverty line, and the vulnerability line:
- The extreme poverty line is defined as the level of income necessary for a person to be able to acquire a basket of goods that achieves a minimum daily caloric level.
- The poverty line is slightly above the extreme poverty threshold, defined as an income level that can cover the basic necessities, including essential food consumption of some goods and services, and shelter. This level depends on a country’s level of economic development.
- The vulnerability line is the boundary for the middle class. A household is defined as belonging to the middle class if its income level and income-generating capacities are such that it is resilient to economic shocks and thus is not at high risk of falling into poverty. The income of a vulnerable household is above the poverty line, but it is insufficient to be considered the income of a middle-class household.
To calculate the vulnerability line, we use the definitions proposed by researchers Luis Felipe Lopez-Calva and Eduardo Ortiz-Juarez.3 This approach is based on the probability of a household falling into poverty, so the thresholds may shift if anything affecting these probabilities change. The following steps are used to define the thresholds:
- Estimate the poverty line for the country using a conventional poverty measurement method.
- Calculate the probability of a household falling into poverty over a given period, such as five years.
- Define the lower bound of the middle class (the vulnerability line) as the income level at which the probability of falling into poverty is 50%.
The researchers define the upper bound of the middle class as the income level at which the probability of falling into poverty is 10%. Households with a smaller probability of falling into poverty are the ‘upper class’.
With these thresholds defined, we can calculate the proportion of the population living below the poverty line or extreme poverty line, known as the poverty or extreme poverty rates. The red area on the left of Figure 5 represents the extreme poverty rate, indicating the proportion of the population living on per capita income less than the extreme poverty line. The sum of the yellow and red areas represents the poverty rate, which is the proportion of the population living with a per capita income below the poverty line.
As Figure 5 shows, the distribution of income in an unequal society is characterized by an average per capita income that is close to the poverty line. This distribution has a fat ‘left tail’ and a long and thin ‘right tail’: most of the population in this country have relatively low per capita incomes, while a small proportion enjoys very high per capita incomes. According to official estimates, in Colombia in 2023, 11.5% of the population lived below the extreme poverty line, 21.5% lived below the poverty line, 31.5% lived in a vulnerable condition, and 32.4% of the population had a sufficient per capita income to avoid vulnerability and be considered middle or upper class.4
2021 PPP (purchasing power parity) refers to a conversion rate that equalizes the purchasing power of different currencies as of 2021, so that a dollar amount in one country reflects the same real buying capacity in another country. It is used to make cross-country income comparisons meaningful by adjusting for price differences.
To learn more about purchasing power parity, read Section 3.4 of The Economy 2.0: Macroeconomics.
It is important to understand that there is no single ‘correct’ answer for these thresholds: different methods to estimate the probability of falling into poverty can result in different poverty lines and estimates of poverty rates. It is also important to take country- or region-specific factors into consideration when setting the thresholds. For low-income countries such as those in Latin America and the Caribbean, the World Bank uses a threshold of USD 4.00 per day (adjusted for 2021 PPP) for extreme poverty, USD 6.85 for poverty, and USD 14 for the vulnerability line. For the US, the World Bank defines the poverty line at 29.40 USD a day, but there is no definition of the vulnerability zone because it is established using a probabilistic model measuring the effects of historical shocks and the probability of falling below the poverty line level. For international comparisons, it is useful to define the vulnerability line at 2.5 times the level of the poverty line for each country. Using this approach, the vulnerability zone for the US would be between 29.40 and 73.50 USD (in 2021 PPP) a day.
These threshold definitions allow us to consider the case of a general income shock in a country with high inequality and a high incidence of vulnerability. One example is the COVID-19 pandemic, where the incidence of poverty increased to levels not seen in a decade in Latin American countries. In these economies, the COVID-19 shock mainly affected vulnerable households, as economic paralysis was concentrated in industries with a high level of informal employment, such as commerce and services. Another example is the 2007–2009 global financial crisis, which affected the informal sector more than the formal sector.
The red curve in Figure 6 shows the new income distribution after the pandemic. A higher concentration of the population is below the poverty line and the portion of vulnerable people has shrunk. The grey area represents the proportion of vulnerable people that fell into poverty, while the red area shows the proportion of people who fell below the poverty line after the shock. In this example, those areas are very similar because most people who fell into poverty were those who were vulnerable before the shock.

Figure 6 Changes in the income distribution after a shock.
Job quality is determined by job satisfaction, job well-being, job autonomy, job security, and pay.
For example, consider a family with a low-quality job with insufficient current income. They can only afford necessities such as housing and food, and may lack savings or access to financial resources (which in turn limits their ability to smooth consumption after a shock). A shock like the COVID-19 pandemic can lead to job loss (especially among workers with low-quality jobs) and a significant reduction in income, as the lockdown imposed by health authorities dramatically decreased the demand for goods and services of many industries, with businesses shutting down operations and laying off people temporarily or permanently. This situation could push this family into poverty without any financial safety net.
Income generation and vulnerability to shocks
Vulnerability can be influenced by various factors related to an individual’s or household’s ability to generate income, which in turn depend on their endowments. These endowments include education level, accidents of birth (such as the country you were born in), race, gender, wealth, and physical assets.
To understand the relationship between income generation and vulnerability, we use a conceptual model of inequality transmission from Unit 19 of The Economy 1.0.
Modelling income generation
Figure 7 illustrates the interactions between endowments, technology, and institutions, and how they impact income. Let’s first define these factors:
- Endowments are the assets people have (inherited and/or acquired) that can help them earn money, including education, rights, skills, and talents, but also their savings and other capital goods. Individuals with higher levels of education and skills tend to earn more money, and those with exceptional talents can often command higher salaries.
- Technology can also affect income levels. Technological advancements can create new job opportunities while making some jobs obsolete. For example, the development of computers has created many new jobs in the tech industry, but it has also led to the loss of some jobs in other industries. The case of apps for the gig economy, such as delivery and transportation, is another example.
- Institutions are the rules, regulations, and social norms that govern a society. They can also significantly impact income levels. For example, a country with a robust social safety net may have lower income inequality than a weak one. Similarly, a country with an adequate and inclusive educational system (affordable and accessible to all) will make it easier for people to get the education they need to earn a good income. Policies affect the endowments of households and individuals, impacting their capacity to generate income. For example, countries that provide higher education for free or at highly subsidized rates enable people to possess an additional endowment (a higher education degree), which positions them to secure higher-paying graduate-level jobs.

Figure 7 The causal relationships between income, technology, institutions, and endowments.
Adapted from Figure 19.16 of The Economy 1.0.
The different factors that affect income levels can interact in complex ways. For instance, technology can affect the value of endowments. The development of computers and the internet has enabled people to acquire new skills online, thereby increasing the value of education. These gains in productivity due to access to technology can be improved by a good institutional environment. For example, in a country with clear and enforced laws, it is more likely to be possible to carry out economic transactions such as buying and selling highly technical agricultural products or to have an employment relationship in a highly specialized industry. When the institutions that protect contracts are not enforced or are poorly defined, household income is more uncertain, and people may be exposed to default on payments or commitments. In these circumstances, individual effort is less productive.
From income generation to vulnerability
Factors that affect the ability of households to generate income are also related to the capacity to cope with a shock and respond to it (vulnerability) as follows:
- Endowments: Income is determined by the endowments that a person possesses. People with endowments, such as access to education, financial resources (wealth), and rights that guarantee equality and opportunities (such as protection for discrimination), are more likely to have high-paid and formal jobs. Consequently, their income vulnerability and risk are reduced because higher income levels enable individuals to establish a financial safety net, safeguarding their well-being in the face of an unexpected shock.
- Technology: Technological advances can provide tools and systems that change the availability of endowments and therefore reduce the causes of vulnerability. For example, technological advances (such as a new irrigation system) allow for better land productivity, thereby increasing its value and the endowment of the individual who owns it. At the same time, other technological changes (like search engines) can provide better access to information that can help governments of low- and middle-income countries with budget constraints identify vulnerable families and implement vulnerability mitigation policies assertively. Technology can also promote financial inclusion. For example, mobile apps and digital financial services can facilitate access to essential financial services for those who do not have access to traditional banking or access to credit.
- Institutions and policies: Endowments can change over time, and these changes can be generated through policies, access to technology, and shocks. Policies play an important role in shaping and transforming endowments and, consequently, affect exposure to vulnerability. Policies aimed at increasing access to education change the human capital of households, for example, through improved productivity, which in turn affects the possibilities of entering the labour market and earning income that keeps them away from the vulnerability zone. The government and policymakers’ decisions and actions in social protection, food security, public health, education, and other infrastructure affect people’s resources in risky situations.
Figure 8 extends the model from Figure 7 to include factors influencing individual vulnerability.

Figure 8 The causal relationships between income generation, resilience, vulnerability, and poverty.
The interaction of technology, government, social institutions, initial endowments, and the labour market ultimately shapes a household’s income generation potential. Households endowed with the latest technology, supported by effective institutions, possessing substantial physical, human, and social capital, and able to access high-quality jobs in vibrant labour markets are more likely to achieve higher income levels. Conversely, households deprived of these advantages are more susceptible to experiencing lower income levels.
This model helps explain the differences between households, economic inequality, and the possibility that some people can cope with financial shocks while others fall into poverty traps. It helps us understand the difference between vulnerability to poverty and resilience, as follows:
- Vulnerability: Low income, limited wealth, and low education along with weak state institutions and precarious labour markets increase the probability of falling into poverty upon a mild shock.
- Resilience: Households with higher income, wealth, and education often reside in areas with robust institutions and more favourable labour markets. These factors allow these resilient households to overcome shocks with minor changes in their income. However, resilience is not a static characteristic—it can be built or eroded over time through policy changes or cumulative shocks.
Exercise 1 Understanding resilience and its relationship with institutions
- Use the model in Figure 8 to explain what happens to a vulnerable household that faces the following events:
- An economic shock shuts down the industry where some members of a household work for a wage.
- A natural shock destroys the endowments (land and livestock) that this household had for its main livelihood, as in the case of floods in countries like Pakistan in 2022.
- For each of the events described above, what kinds of institutions and policies could improve the vulnerable household’s income resilience?
Question 2 Choose the correct answer(s)
Based on the information in this section, read the following statements and choose the correct option(s):
- As shown in Figures 7 and 8, all these factors influence whether a person or household is vulnerable.
- Higher levels of human capital enhance employment opportunities and economic stability, reducing vulnerability.
- Effective policies and technological advancements can indeed improve resilience and reduce exposure to vulnerability by altering endowments and enhancing economic stability.
- Resilient households still have some probability of falling into poverty, but this probability is much smaller than that of a vulnerable household.
Question 3 Choose the correct answer(s)
Which of the following situations is a good example of vulnerability?
- Maria has a stable income and strong financial backing, so she can withstand a minor income shock.
- Simon has a stable income and endowments (a house) that he could sell if he needs income.
- Sofia has human capital endowments (writing skills) that she can use to generate income.
- Juan does not have a stable income level that allows him to pay for his essential needs.
Unequal exposure to vulnerability: Institutions, endowments, and capacities
The extent of exposure to vulnerability, such as the risk of income loss, varies depending on both country and household characteristics. Consider a low-income and a high-income country. In the low-income country, limited access to credit, high levels of informality, and low social insurance coverage are common issues. Additionally, agriculture plays a crucial role in the economy, leading to high exposure to uncontrollable phenomena that farmers cannot control and are not covered by formal insurance, such as droughts and price fluctuations. Meanwhile, in high-income countries, services are the primary economic activity, there is greater access to credit and social protection, and a large proportion of the population has a formal job and unemployment insurance.
Now think of the two families that were introduced in Section 1, living in a middle-income country (Colombia). The Rodriguez family comprises six members. The two adults in the family have primary education and jobs in the informal sector, while the other four family members are children who cannot work and need to be educated and fed. The Rodriguez’s income is just above the poverty line, and is mostly spent on providing food for the household. They are not classified as poor but they have no savings, property, or financial support networks to help them through a crisis. In addition, they do not have home insurance that allows them to protect themselves from natural disasters. (In many low- and middle-income countries, these households are often excluded from home insurance due to the lack of formal property rights, and because they tend to live in areas susceptible to natural disasters such as floods, landslides, or earthquakes.)
Meanwhile, the Del Castillo family consists of two parents and a child. Both parents work in the tech industry and have a solid professional background and high-quality university education. Both have stable jobs where they earn four times the country’s median salary and they have private health and pension insurance. Consequently, they have given their daughter, Anita, a university education, they have savings, two properties, and guarantees to access credit. In a crisis, Anita’s family can use their financial wealth to maintain the same quality of life.
The Del Castillo family’s lack of economic vulnerability is due to the endowments they possess. Endowments like their educational level, specialized skills, a financial cushion, and the country’s regulations of the financial sector allow them to access credit and be insured much more easily than the Rodriguez family. Public policies at the local level further strengthen these advantages or endowments. In the capital city, Bogotá, policies that support inclusive high-quality education, establish resilient financial institutions, regulate the credit sector, and offer structures for property rights and insurance are vital. These initiatives empower families such as the Del Castillos to obtain loans, invest in assets, and safeguard their wealth through insurance. In contrast, in the rural area, where the Rodriguez family lives, because of the absence of supportive policies and institutions, families could be more vulnerable to economic shocks.
The role of informality and social security
In an economy, these benefits act as automatic stabilizers because they offset the effects of economic booms and recessions.
- automatic stabilizers
- Automatic stabilizers are tax and transfer policies that have the effect of offsetting an expansion or contraction of the economy. For example, spending on unemployment benefits rises during a recession.
In a country where informality is low, the financial system is easily accessible, and the government implements risk mitigation policies, the likelihood of the Rodriguez family slipping into poverty would be significantly reduced. To illustrate, let’s consider another low-income family, the Gonzales family. The Gonzales family has similar initial endowments and income-earning capacities to those of the Rodriguez family, but the Gonzales family lives in the US, a high-income country that provides government subsidies, access to loans, and unemployment insurance. So, the Gonzales family’s probability of falling into poverty is much lower than that of the Rodriguez family.
In addition, the Gonzales family lives in a country with a more stable economy, where labour and business informality are minimal. In contrast, the Rodriguez family does not have access to stable employment contracts, and formal laws do not regulate their sources of income generation. Though the Gonzales family earns only the minimum legal wage, they have access to various social security benefits, thanks to their formal employment. While the Gonzales family works for a highly productive company with over 50 employees, making them more likely to withstand economic shocks, the Rodriguez family relies on informal employment or self-employment, which is common among low-income households in low-income countries. This situation leaves them highly vulnerable during a financial crisis and limits their access to legal protection and social safety nets. Therefore, negative economic shocks can lead to a higher likelihood of job loss for the Rodriguez family than the Gonzales family.
To help you understand the implications of vulnerability to poverty and its determinants, we developed an interactive visualization tool, which you can read about in the ‘Find out more’ box.
Exercise 2 Divergent life stories
Consider the situation of the Gonzales, Rodriguez, and Del Castillo families discussed in this section.
- Give three examples of disparities in endowments and institutions among these families that explain their different levels of vulnerability.
- Give two scenarios that show how other institutions (not mentioned in the families’ descriptions) could affect these families’ vulnerability to poverty.
Find out more A visualization tool: Vulnerability to poverty and income shock simulation
The visualization tool we have developed uses actual data from Colombia, sourced from official household surveys. You can access the vulnerability visualization tool, and watch a video explaining the tool and how to use it.
To learn more about the Lorenz curve and Gini coefficient, read Section 5.12 of The Economy 2.0: Microeconomics.
- Lorenz curve
- A graphical representation of the inequality of some quantity such as income or wealth. Taking income as an example, individuals in the population are arranged in ascending order of income. First we calculate the total income of the population. Then for each level of income, we plot the percentage of total income held by people at this income level or lower against the percentage of people at this income level or lower. The area between the Lorenz curve and the 45-degree line, expressed as a fraction of the total area below the 45-degree line, is a measure of inequality. Other than for small populations, it is a close approximation to the Gini coefficient. See also: Gini coefficient.
- Gini coefficient
- A measure of inequality of a quantity such as income or wealth, varying from a value of zero (if there is no inequality) to one (if a single individual receives all of it). It is the average difference in, say, income between every pair of individuals in the population relative to the mean income, multiplied by one-half. Other than for small populations, a close approximation to the Gini coefficient can be calculated from a Lorenz curve diagram. See also: Lorenz curve.
This tool allows you to explore how different income shocks can affect a country’s poverty indicators and income distribution. It provides visualizations and summary statistics related to the country’s income distribution, including the Lorenz curve, poverty rate, and the Gini coefficient.
Figure 9 shows the simulation tool’s outputs. The simulation applies an income shock in real time to the population based on criteria you can select, as shown in Figure 10. The meaning of each criteria is as follows:
- Education level: The highest level of education reached within the household. Values are classified as: ‘very low’ for those without a high school qualification, ‘low’ for high school graduates, ‘medium’ for technical or vocational training, ‘high’ for university graduates, and ‘very high’ for those with postgraduate degrees. You must select at least one level and can choose multiple levels.
- Source of income: The type of income, formal or informal, affected by the shock, where ‘formal’ is used if a person contributes to health and pension insurance and ‘informal’ otherwise. You must select at least one type of income and can choose both.
- Location area: The user can specify if the household lives in a rural or urban area. You must select at least one value and can choose both.
- Shock magnitude: Percentage of the population for whom the selected source of income will be reduced. You must choose a value on the slider.
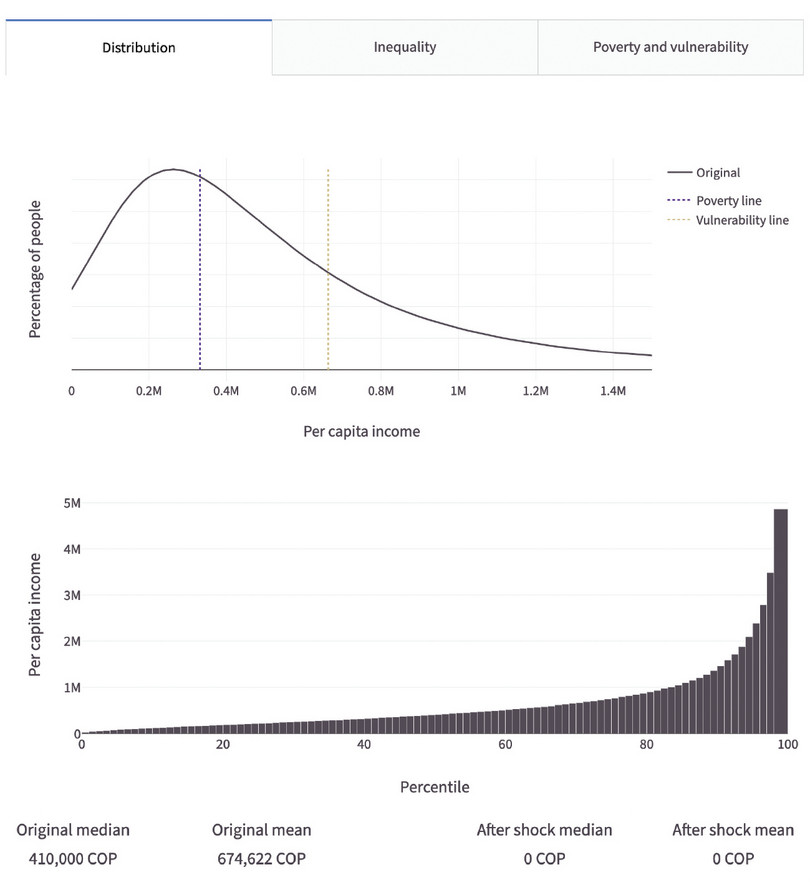
Figure 9 Screenshot of the simulation tool.
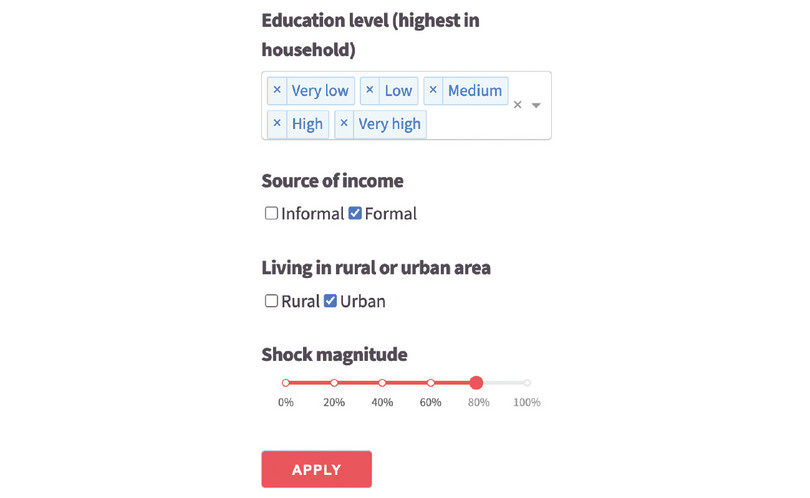
Figure 10 Criteria for the simulation.
After selecting at least one value for each criterion, select the ‘Apply’ button to apply these criteria to the dataset. The underlying data will be modified, and all visualizations and summary statistics related to the country’s income distribution will be updated to reflect the impact of the shock. You can display the original distribution to compare it with the aftermath of the shock.
Examples of shocks
We will use two very different types of shocks to show you how to use this visualization tool.
The first example is a large shock (60%) to the formal income of the most educated people living in urban areas (Figure 11, top panel). The population defined by this set of variables should, in theory, be the wealthiest in the country. After applying this shock, the income distribution significantly changes for the highest percentiles of per capita income, and the Gini coefficient decreases (Figure 11, bottom panel). Interestingly, monetary poverty does not change, showing that even if this segment of the population receives a large shock to its income, it will remain above the poverty line.
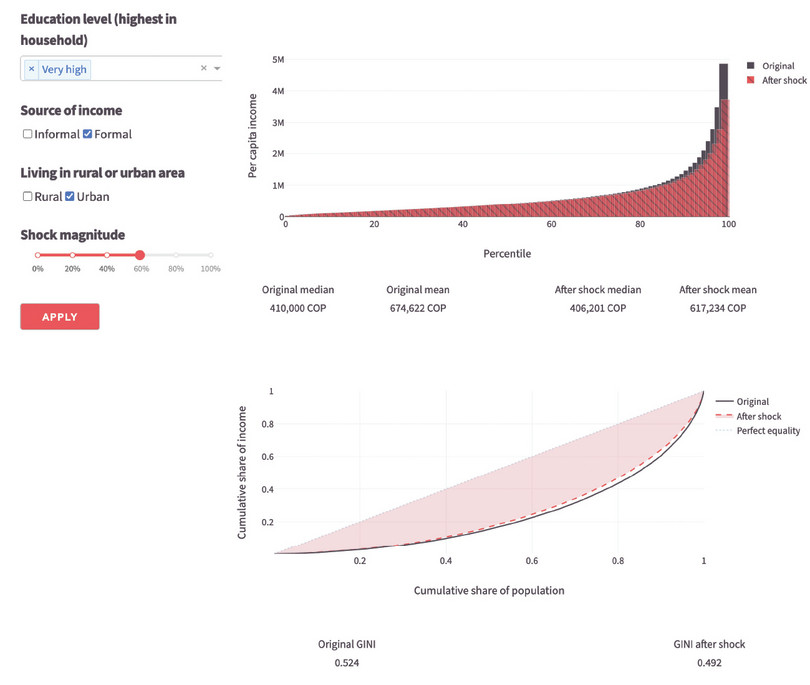
Figure 11 Example of a 60% magnitude shock on the urban population with very high education (top panel) and its consequences on the Gini coefficient (bottom panel).
The second example is a large shock (40%) to the informal income of urban households with low education levels (Figure 12, top panel). This segment of the population is very vulnerable to income shocks. This shock increases monetary poverty by five percentage points (from 38% to 43%) and increases the Gini coefficient by 0.2. The income distribution shifts to the left, reflecting a decrease in income for a large population segment (Figure 12, bottom panel).
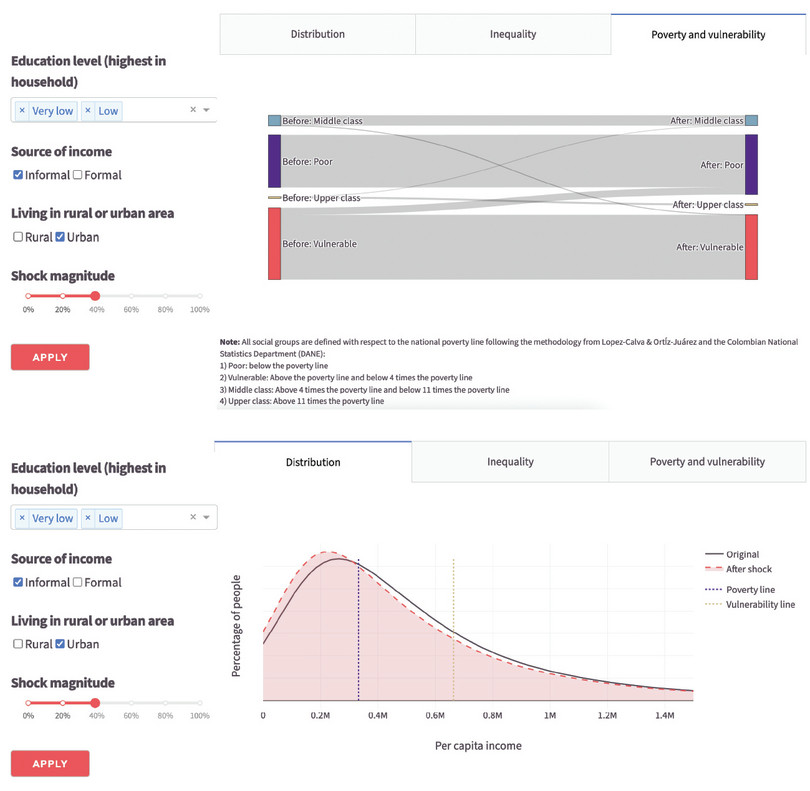
Figure 12 Example of a 40% magnitude income shock on the urban population with low education (top panel) and its consequences on the income distribution (bottom panel).
To further explore how a country’s population is affected by different shocks, try Exercise 3 and Exercise 4.
Exercise 3 Simulating an income shock and its effects on vulnerability, the income distribution, and poverty
The Lorenz curve shows how a population’s income or wealth is distributed. It illustrates what portion of the total income is earned by different population percentages. The curve compares the cumulative share of income on one axis to the cumulative share of the population on the other. The curve would be a straight line if everyone had the same income. The more the curve bends away from this line, the greater the inequality in income distribution.
Using the interactive tool, simulate different sizes of shocks directed towards households with very low/low education levels and informal income. Discuss the changes in the monetary poverty index and the Lorenz curve. How do changes in the rural/urban criterion affect the results? By comparing the income distributions, explain how vulnerability in the population changes.
Exercise 4 Comparing the effects of an income shock on different households
Follow the steps below to compare the differences between a shock to the income of formal, urban, and highly/very highly educated households with a shock of a similar size that affects households with very low/low levels of education, with an informal source of income, and that are living in the urban area.
- Open the visualization tool and set the baseline scenario (urban households with formal employment and high/very high education levels).
- Specify the size of the income shock you want to analyse.
- Set up the second scenario for comparison, which involves a shock of the same size. However, this time, it affects households with very low and low levels of education, that rely on informal income sources and are situated in urban areas.
- Run the simulation.
What effects do you observe on inequality from changes in the Gini coefficient and monetary poverty? Comment on whether these results would differ in a high-income country with very low informality levels.
-
Government of Pakistan, Asian Development Bank, European Union, United Nations Development Programme, and World Bank. 2022. Pakistan Floods 2022: Post-Disaster Needs Assessment. ↩
-
Gallardo, Mauricio. 2018. ‘Identifying Vulnerability to Poverty: A Critical Survey’. Journal of Economic Surveys 32(4): pp. 1074–1105. ↩
-
Lopez-Calva, Luis F., and Eduardo Ortiz-Juarez. 2011. ‘A Vulnerability Approach to the Definition of the Middle Class’. World Bank Policy Research Working Paper No. 5902, December. ↩
-
Departamento Administrativo Nacional de Estadística (DANE) (National Administrative Department of Statistics). 2024. Pobreza multidimensional en Colombia (Multidimensional poverty in Colombia) 2023. ↩
