Experiment 8 Competing standards
8.1 Introduction
CORE projects
Concepts in the experiment are related to the material in:
- Unit 21 in The Economy 1.0.
How did Facebook come to dominate the market for social networks? What became of MySpace and Second Life? Do you know of Hipstamatic, a first direct competitor when Instagram was launched? This experiment features a fierce battle for market supremacy between firms that offer products that are substitutes, in an environment where a product can quickly become popular and oust the competition.
In this experiment, there will be three sellers of computer operating systems who compete in a market of identical consumers. Demanders must buy an operating system or face social exclusion. People with different operating systems are not able to exchange files and other information as easily as those with the same operating system. Therefore, buyers will exhibit network economies of scale and will value operating systems by the number of users in each case.
This experiment can easily be combined in the same session with the experiment Network economies of scale: The Holophone. Both experiments share a similar mechanism, and students can use what they learned by reading the instructions of that experiment to participate in this one.
This experiment is inspired by Session 2 of ‘Network Externalities’ in Experiments with Economic Principles: Microeconomics by Ted Bergstrom and John Miller.
Citation: Llavador, Humberto, Marcus Giamattei, Ted Bergstrom, and John H. Miller. 2023. ‘Competing Standards’. Experiment 8 in The CORE Team, Experiencing Economics. Available at https://www.core-econ.org/experiencing-economics [Accessed on (date)].
Key concepts
This experiment will help students understand the following key concepts:
- network economies of scale
- network externalities
- competing standards
- the lock-in effect.
8.2 Requirements
Timing
The experiment takes 10 to 20 minutes to complete, depending on the number of participating students and how fast a seller becomes the monopolist. It is recommended to provide students with access to the instructions and the warm-up questions beforehand, so that they can have enough time to think of successful pricing strategies.
8.3 Description of the experiment
In this experiment, three operating systems (OSs) compete in a market of identical consumers. In each round, the three sellers simultaneously announce a regular price and, if they want, a number of units for sale at a discount price. Sellers cannot set a price below their marginal cost of €5 per unit sold. In addition to the marginal cost, sellers have an initial fixed cost of €75 in the first round, and an additional €50 fixed cost for each round that they remain in business.
8.4 Step-by-step guide
Detailed instructions
Go to the ‘Quick summary’ section if you have previously run the experiment and just need a brief reminder of the instructions.
8.5 Student instructions
These are also available in the students’ version.
A PDF of the student instructions and homework questions is also available.
Introduction
In this experiment, there will be three sellers of operating systems (OSs). At the beginning of each round, they simultaneously have to announce a price and, if they want, a number of units offered at a discount price. Buyers are all identical. In the first round, they will have to decide which OS to buy for their computer. Future rounds represent new versions of the OS and buyers must decide to buy the updated version of their OS or switch to another OS. They can also opt not to buy any OS and suffer social exclusion. The OSs are all equally good, but they are not fully compatible with each other. Users with different OSs cannot easily share files and other information. Therefore, the value of an OS for a buyer will be determined by the number of users with the same OS at the end of the round. Your instructor will display a table showing the way buyer values are related to the number of people who purchase the product. (See Figure A for an example of such a table.)
Buyers’ information
As a buyer, you want to maximize your profits in each round. Note that profits do not accumulate from one round to the next. You need to buy the latest version of one of the available OS in each round at the announced price, or suffer social exclusion (at a cost of €100).
At the beginning of each round, you will see the table of buyer values and the prices announced by each seller. Prices do not change during a round. You will also see if there are any units at a discount price (Figure A). During the round, the instructor’s screen displays in real time the current sales number for each OS.
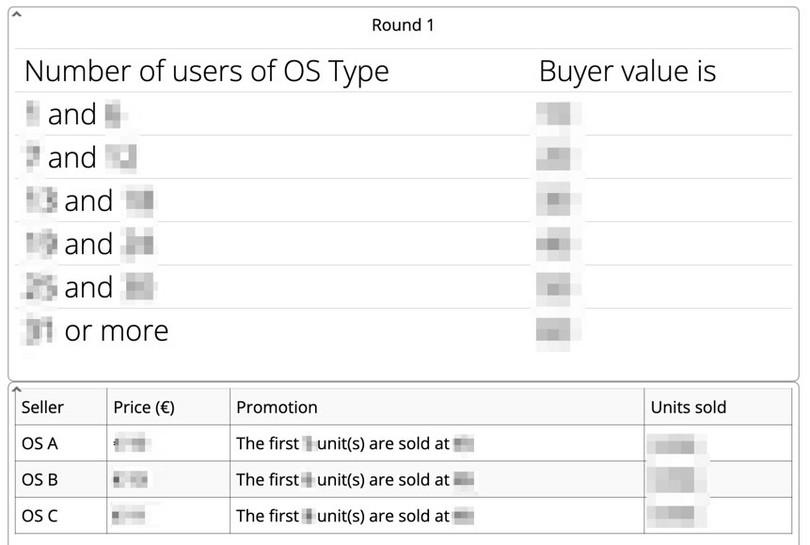
Figure A Buyer values and announced prices. The number of units sold of each OS are updated live during the round.
At the end of the round, you will receive the buyer value for your OS, which is determined by the number of users of that OS (Figure A).
Learning an OS is costly. The first time you buy an OS, and every time you switch to a different OS, you will have a learning cost of €15. For example, if you buy \(OS^A\) in Round 1, your profits will be
\[\begin{align*} \text{buyer value of } OS^A \text{ in Round 1 } – \text{ price of } OS^A \text{ in Round 1 } – \text{€}15, \end{align*}\]where the buyer value will be determined by the number of users of \(OS^A\) at the end of the round and the last €15 represents the learning costs.
In Round 2, if you buy the new version of \(OS^A\), then your profits will be
\[\begin{align*} \text{buyer value of } OS^A \text{ in Round 2 } – \text{ price of } OS^A \text{ in Round 2}. \end{align*}\]On the other hand, if you switch to \(OS^B\) in Round 2, then your profits will be
\[\begin{align*} \text{buyer value of } OS^B \text{ in Round 2 } – \text{ price of } OS^B \text{ in Round 2 } – \text{€}15, \end{align*}\]since you need to learn the new OS.
Remember, every time you change your OS from one round to the next, you need to pay the learning cost, even if you used that OS in earlier rounds.
Finally, if you decide not to buy an OS, you will receive a loss of €100 (representing social exclusion), plus you will have to pay the learning cost if you buy an OS in the following round.
Sellers’ information
As a seller, you want to maximize your profits at the end of the experiment. Notice that sellers’ profits, unlike buyers’, accumulate from one round to another in order to allow for long-term strategies. At the beginning of each round, sellers must set the following simultaneously, and without talking to each other: the price of their OS, the number of units they want to sell at a discount price, if any, and the discount price (Figure B). Dumping is forbidden, so sellers cannot price below the cost of production of €5.

Figure B Price setting screen for Round 1. Sellers must set a regular price \(P\) for their OS, the number of units they want to sell at a discount price (\(Ud\)), and the discount price (\(Pd\)). Sellers cannot sell below the marginal cost of €5.
At the end of each round, you receive the revenue of your sales (the prices paid by the buyers of your OS) and you have to pay the costs of production. Each unit sold costs €5 (the marginal cost). Developing an OS has a fixed cost of €75 that you must pay in the first round. After the first round, for each round you remain in the market, you have to pay a €50 fixed cost in R&D for the new version of your OS. The fixed costs are independent of the number of units sold. For example, the profits of seller \(A\) in Round 1 will be
\[\begin{align*} \text{sum of prices paid for } OS^A - \text{ units of } OS^A \text{ sold} \times \text{€}5 - \text{€}75 \end{align*}\]where the last two components are the variable and fixed costs, respectively. For later rounds, profits are calculated as
\[\begin{align*} \text{sum of prices paid for } OS^A - \text{ units of } OS^A \text{ sold} \times \text{€}5 - \text{€}50 \end{align*}\]At the end of each round, firms will be evaluated by their shareholders (represented by the instructor). Those whose market share falls below 16% are considered not viable and will have to abandon the market. Shareholders may force bankruptcy on firms with excessive losses. Bankrupt firms will have to leave the market. Each seller can also decide whether to drop out or continue into the next round.
There will be at least two rounds and no more than ten, but sellers do not know the exact number of rounds. At the end of the last round of play, those firms who are still in business will receive an additional €15 per current customer. (This payment represents the value to the seller of an installed customer base.) Hence, the final profits for a seller still in the market are
\[\begin{align*} \text{cumulative profits} + 15 \times \text{current customers}. \end{align*}\]Warm-up questions
You can use the following questions to test your understanding of the rules.
Consider the buyer values table shown in Figure C. Suppose that in Round 1, \(OS^A\) sells 25 units at €7, \(OS^B\) sells 10 units at €15, and \(OS^C\) sells 15 units at €10.
| Number of users of OS | Buyer value |
|---|---|
| 1 and 8 | 10 |
| 9 and 16 | 20 |
| 17 and 24 | 30 |
| 25 and 32 | 40 |
| 33 and 40 | 50 |
| 41 or more | 60 |
Figure C Example of buyer values of an OS.
- What is the buyer value of each OS to one of its buyers?
- In Round 1, if you bought \(OS^A\), what are your profits?
- You bought \(OS^A\) in Round 1. In Round 2, the price of \(OS^A\) increases to €30 while the price of \(OS^B\) drops to 5, and the final number of buyers is the same as in Round 1. What are your profits from buying \(A\)? And from buying \(B\)? (Do not forget the learning costs.)
- What are the costs of the seller of \(OS^A\) in Round 1?
- The buyer values are 40, 20, and 20 for users of \(OS^A\), \(OS^B\), and \(OS^C\), respectively.
- Your buyer value = 40, you paid €7, and the learning costs are €15. Therefore your profits are 40 – 7 – 15 = 18 euros.
- If you buy \(OS^A\), your buyer value = 40 and you pay €30, therefore your profits are 40 – 30 = 10 euros. If you buy \(OS^B\), your buyer value = 20 and you pay €5, but you also need to incur into the learning costs because you changed the OS. Therefore your profits are 20 – 5 – 15 = 0 euros.
- Seller A has a fixed cost of €75 in Round 1 plus a variable cost 280 euros (40 units at cost of €5 each). Therefore, total cost are 75 + 280 = 355 euros.
8.6 Predictions
Predicted results
Theory does not provide us with detailed guidance about what to expect. The most common situation results in a firm with a monopoly or a dominant market share after three or four rounds. And an important lesson from this experiment is to show how easily a monopolist may emerge in this type of market. However, it is not uncommon for two firms to continue to hold significant market shares for a couple of rounds without signs that the outcome will change.
8.7 Discussion
A good discussion during and after the experiment is important. Ask your students the following questions to frame the discussion.
Note that comments in the ‘Predictions’ and ‘What might go differently’ sections, and in The Economy 1.0 (Section 21.4) provide useful further information.
8.8 Homework questions
These questions can be set for students to work on outside the classroom or can be completed and discussed in the classroom. They may help students reflect on their experience and understand their and others’ behaviour in the experiment.
You have to provide your students with the information in the following table (Figure D):
| Firm A | Regular price | Units sold at regular price | Sale price | Units sold at sale price | Total profits |
|---|---|---|---|---|---|
| First round | |||||
| Last round(*) | |||||
| Firm B | Regular price | Units sold at regular price | Sale price | Units sold at sale price | Total profits |
| First round | |||||
| Last round(*) | |||||
| Firm C | Regular price | Units sold at regular price | Sale price | Units sold at sale price | Total profits |
| First round | |||||
| Last round(*) |
Figure D Price policies, sales, and profits for the three firms in the first and last rounds. (*)A firm that abandoned the market before the last round shows a price equal to 0, 0 units sold, and its final profits (or losses).
Data from your experiment can be downloaded as an Excel file from the ‘Data’ menu in the instructor’s screen in classEx. You can also use this data to create your own questions. A description of the data variables can be found in the ‘Downloading the data from your experiment’ section.
The following text is also available in the students’ version.
Your instructor shared with you the following information regarding each firm in the experiment: price policies, units sold, and total profits for the first and last rounds.
- In the last round, what percentage of all sales was made by the largest firm?
- Did the firm with the largest share in the first round have the largest share in the final round?
- Did the firm with the largest share make the greatest total profits?
- If there was only one firm in the market during the last round, what would be its profit-maximizing price policy? (Assume that all buyers are already users of its OS, and therefore do not need to pay the learning cost.) What would be the profits for buyers?
- Describe the price and marketing strategy you would have used to try to win the whole market for your product. How would you expect the other firms to react to your strategy?
8.9 Further reading
Also available in the students’ version.
- Section 21.4 in The Economy 1.0 discusses many examples of price wars among competing standards.
- ‘Why VHS was better than Betamax’ (Jack Schofield for The Guardian, 25 January 2003) explains how Sony Betamax made a strategic error and by the time they tried to fix it, there were so many more VHS users that the Betamax format all but disappeared.
- ‘Why Facebook is a better bet than Google was’ (Robert Wright for The Atlantic, 17 May 2012) uses network economies of scale to explain why Google+ failed against Facebook.
- ‘MySpace was born of ignorance’ (Planet Money #84, NPR, 25 August 2009) describes the flaws in MySpace that made the site fail to become the leading network, despite being created before Facebook.
