
CORE Econ Publishing Documentation The CORE artwork style
Artwork stylesheet
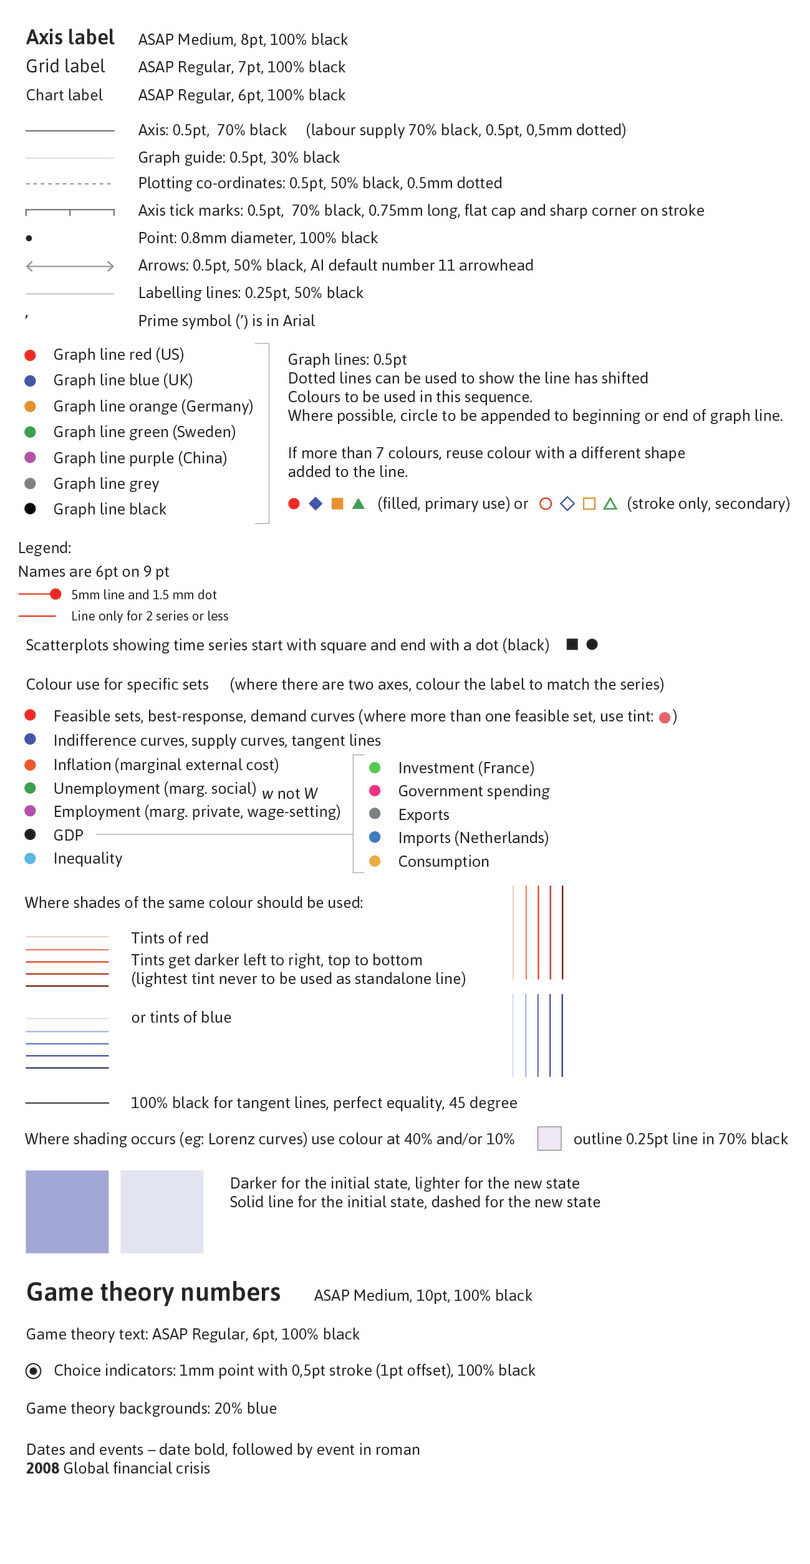
All figures must follow the design stylesheet:
These styles are already set up in the core-figure-automation repository (contact EBW for access) for automated, data figures.
For manual, non-data figures, this stylesheet needs to be imported into Adobe Illustrator to ensure consistency. Contact EBW for the Illustrator-compatible files. Also see the next section for the specs to be used for Illustrator files.
For editorial conventions, see the figure axes house style.
Illustrator specs for creating manual, non-data figures
- File type: Adobe Illustrator,
.aifiles. - Artboard size: 110 mm wide. Use full artboard width, don’t leave more than a fraction of white space left or right unless the art requires it or leaves no option. Height can vary.
- Check for transparency. To comply with printing standards, Illustrator files cannot contain transparency (even in hidden layers) when generating SVGs. Contact EBW for guidelines on removing and emulating gradients.
- Follow the SVG-export guidelines: See the Exporting manual figures as SVGs section of the production guidelines.
Flowcharts
Flowcharts must follow the CORE look and feel but, to accommodate the wide varieties in their designs, don’t have a strict set of styles. To maintain the CORE look and feel they use the standard artwork colours and fonts. The flowchart can differ from the figure styles in its use of font and line weights and other visual elements that might aid understanding of the flowchart.
As far as possible, EBW bases the design of new flowcharts off of existing ones for a cohesive look in CORE projects.
Excel and Google Sheets walk-throughs
Economy, Society, and Public Policy and Doing Economics include walk-throughs comprised of screenshots with labels added.
When adding labels:
- Use a black arrow and box with the label text.
- Each step is numbered and ends with a full stop, for example, 1. Click ‘Sort & Filter’, then select ‘Filter’.
- When referring to the steps, we use a lower case ‘s’ step 1, not Step 1.
- Buttons that users click or select have an initial capital letter (as they do in Excel and Google Sheets) and are in single quotes, for example, Select all data in Column N, then click ‘Insert’.
- Any text that a user has to type in is introduced by ‘Type:’ followed by the text that needs to be inserted shown in bold using the CORE red. For example, Type: 0
- When the user is choosing an action from a list of options, use ‘Select’ not ‘Click’. For example: Click ‘Sort & Filter’, then select ‘Filter’.
- Where referring to the filter, use ‘dropdown arrows’, not ‘little boxes’ (there are exceptions to this in the Google Sheets walk-throughs). For example: ‘You will see dropdown arrows appear in the bottom right of each cell in Row 3.’
- When referring to Excel or Google Sheets functions, these must be in all caps, not lower case. For example: AVERAGE, not average.
- Each slideline has a title and a caption. The title does not have a fullstop. For example, in the Excel walk-through 1.1 in Doing Economics, the title is ‘The data’ and the caption is ‘How to draw a line chart of temperature and time.’.
- Include shortcuts for Windows, Linux and Mac. Only the Mac shortcut needs to be specified as such, for example, ‘Copy the cell (Ctrl+C, or Cmd+C on Mac)’.
- Use initial capitalization for numbered columns, rows or cells. For example: Column N, Row 3 and Cell A3.
- Refer to charts, not graphs.
- Use the following language options: right-click, not right click; double-click, not double click; deselect, not de-select; and click, not click on.
