Production guidelines
This how-to guide gives general guidance for formatting text within project repository files, and explains how each book feature in the CORE projects is created by applying the relevant syntax.
It is most useful to technical users, translation teams, and EBW production team members, who are working directly into a project repository.
Note
Project repositories are based on one of two generations of Electric Book codebase: V1 (for example, The Economy 1.0) or V2 (for example, The Economy 2.0), as indicated in Project repositories. Formatting, syntax, and classes can vary between these codebase versions. These variations are noted, where relevant, below.
For V2-based repositories, you can also refer to the Electric Book documentation.
Digitization
If you’re working from a Microsoft Word manuscript, you’ll need to first convert the files to raw markdown and clean up the raw markdown. Contact EBW for guidelines.
Formatting text
Markdown
Markdown is a plain-text formatting syntax which allows you to apply styles to text without writing any HTML. Follow these resources for general guidance on using markdown, such as formatting headings and lists, indicating italics or bold font, and so forth.
Kramdown
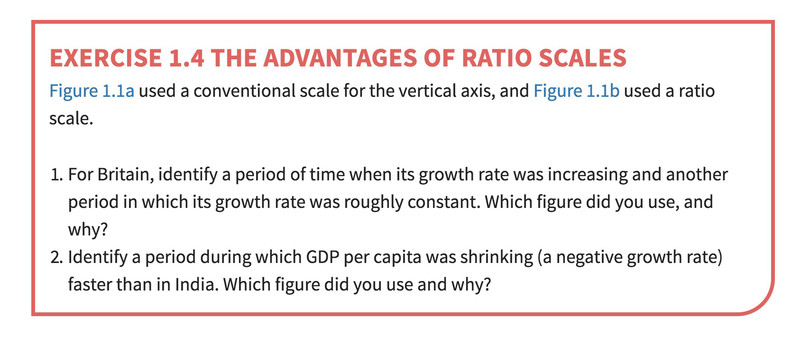
Kramdown is a kind of markdown that allows you to apply pre-defined CSS (Cascading Style Sheets) classes to content, using a kramdown tag ({:}) with a class inside it. For example, using {:.exercise} renders this plain-text:
> ### **Exercise 1.4** The advantages of ratio scales
>
> [Figure 1.1a](#figure-1-1a){:.show-page-number} used a conventional scale for the vertical axis, and [Figure 1.1b](#figure-1-1b){:.show-page-number} used a ratio scale.
>
> 1. For Britain, identify a period of time when its growth rate was increasing and another period in which its growth rate was roughly constant. Which figure did you use, and why?
> 2. Identify a period during which GDP per capita was shrinking (a negative growth rate) faster than in India. Which figure did you use and why?
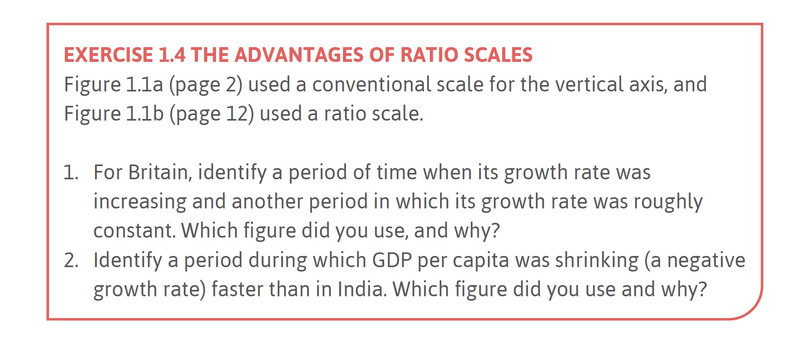
{:.exercise}
as this styled box on The Economy 1.0 website:
and as this styled box in The Economy 1.0 print book:
For general guidance on using Kramdown, follow the Kramdown documentation.
HTML
Some text formatting requires using HTML. These HTML tags and entities are used in CORE projects:
HTML tags and entities
- Table:
<table></table> - Blockquote:
<blockquote></blockquote> - Div:
<div></div> - Superscript:
<sup></sup> - Subscript:
<sub></sub> - Linebreak
<br> - Non-breaking space:
- Discretionary (‘soft’) hyphen:
­
Classes
Electric Book template classes
Many of the Electric Book template content tags (classes) are supported within CORE projects.
CORE projects classes
Additionally, these classes have been designed specifically for the CORE projects:
| CORE projects class | Block or inline | Usage |
|---|---|---|
.great-economist or .great-economists |
Block | See Box features |
.economist or .economists |
Block | See Box features |
.einstein |
Block | See Box features |
.exercise |
Block | See Box features |
.info |
Block | See Box features |
.expandable-box |
Block | See Box features |
.mcq-options and .mcq-feedback |
Block | See Multiple choice questions |
.align-left |
Block | See Tables |
.align-right |
Block | See Tables |
.data-align-right |
Block | See Tables |
.list-nospace-web |
Inline | To remove the space after a final sublist (nested) item in web output. (See the Lists section of the house style.) |
.bump-up |
Block | See Print refinement |
.wide |
Block | This can be applied to all box features, sidenotes, tables, and figures. |
.thumbnail |
Block and inline | See Including images, figures, and slidelines |
.column-break-after |
Block | See Including images, figures, and slidelines |
.pdf-margin-bottom-# |
Block | Sets an explicit margin bottom for headings in PDFs, for instance, where frontmatter headings must stay in place, but space needs to be saved below the H1 in print refinement (for example, preface). The # should be replaced by a number of lines. |
Reserved classes
If you need to create your own classes, avoid using the already-supported class names above, as well as those already reserved for structural elements.
Home page
The text that appears on the home page is stored in multiple places in a project repository.
Using the Spanish translation of The Economy as an example:
- In a V1 repository (for The Economy 1.0), the translated book title appears in:
_data/meta.ymlunder thees:node- the
index.mdfile at the root of the project repository - a translation subfolder, for example,
core/es/index.md.
- In a V2 repository (for The Economy 2.0), the landing page content is in:
- the volume- and language-specific
_data/works/[volume]/es/default.ymlfile - the
es:node of the_data/landing-page.ymlfile.
- the volume- and language-specific
Website buttons
The text for the buttons is stored in _data\locales.yml. To add text for these buttons:
- open the
locales.ymlfile - navigate to the relevant language node, for example,
en:for English,es:for Spanish,fr:for French - add the text between the double quote marks of each node, for example:
nav: home: "Home — *The Economy* 2.0" menu: "Contents" next: "Next" previous: "Previous" back: "←" nav-title: "The Economy 2.0" read: "Read *The Economy* 2.0" - do not change the text, indentation or spacing outside of the double quote marks, as this
.ymlfile relies entirely on the consistent formatting and structure already in place.
Table of contents and sidebar navigation
The table of contents (TOC) file (usually 0-3-contents.md) includes a liquid tag {% include toc %} , which automatically generates the TOC from the headings listed in the toc: node in _data\meta.yml (V1) or _data/works/[book or volume]/[language]/default.yml (V2) file.
The sidebar navigation on the website is also automatically generated from the nav: node of these files.
In V1 projects, the meta.yml file is shared for all the books and translations within the repository. In V2 projects, each book, volume or translation has its own default.yml file.
Each section of the book is listed in a ‘node’ of the relevant file. The example below shows the node for the first few sections of Unit 1 of The Economy 2.0: Microeconomics.
      - label: "1—Prosperity, inequality, and planetary limits"
        link: none
        children:
          - file: "01-prosperity-inequality-01-ibn-battuta"
            label: "1.1 Ibn Battuta’s fourteenth-century travels in a flat world"
          - file: "01-prosperity-inequality-02-historys-hockey-stick"
            label: "1.2 History’s hockey stick"
          - file: "01-prosperity-inequality-02-historys-hockey-stick"
            label: "Extension 1.2: GDP per capita and living standards"
            id: "extension-12-gdp-per-capita-and-living-standards"
          - file: "01-prosperity-inequality-03-climate-change"
            label: "1.3 Another hockey stick: Climate change"
          - file: "01-prosperity-inequality-04-income-inequality"
            label: "1.4 Inequality in global income"
          - file: "01-prosperity-inequality-05-technological-revolution"
            label: "1.5 The continuous technological revolution"
The TOC and navigation are correct when:
- each node is indented to the correct number of spaces
- the correct markdown file is listed within the
file:node - the name of the heading or subheading in
label:matches the corresponding heading in the markdown file - the correct heading ID is added to
id:.
To find the heading ID:
- view the web output of the chapter in your browser
- right-click the heading, then select ‘Inspect’
- copy the text between the quote marks, for example,
id="unit-1-the-capitalist-revolution".
The must be the case for each output format’s products node (that is, print-pdf, web, epub, screen-pdf, app), but note:
- The
webandappnodes can include the samefiles,tocandnavnodes. - The
print-pdfandscreen-pdfnodes can be mostly the same, but thescreen-pdfnode must include a cover. - If you only populate the files list of the
screen-pdfnode, theprint-pdf’stocandnavnodes will be reused in the output. - The
epubnode can reuse theprint-pdf/screen-pdf’sfiles,tocandnavnodes, but there are other requirements specific to this format which need to be added.
List of resources/features
The list of resources (for example, 0-7-resources-list in V1/The Economy 1.0) or features list (for example, 0-7-features-list in V2/The Economy 2.0) only displays in the website and app outputs.
Each item in the list links to the relevant book section using the standard markdown syntax for a link: [the text to link goes here](the destination link goes here).
This example shows the first video listed in The Economy 2.0: Microeconomics’ feature list:
- [Unit 1: Thomas Piketty and James Heckman explain why data is fundamental to their work](01-prosperity-inequality-01-ibn-battuta.html#KMHaT_WUF54)
The list of resources is correct when:
- the text between square brackets
[ ]matches the title of the element being linked - the text between round brackets
( )includes the following, and has no spaces:- the html file name, for example,
01.html - followed by one hash
# - followed by the element’s ID.
- the html file name, for example,
Note
The list of resources should only be created post-proofreading/review, once all corrections have been made to the book, and the content is stable and release-ready.
Rather than creating this list manually, by inspecting each element in the browser, and then copy-pasting each ID into a list, contact EBW for guidelines on the automated process for creating this list, using a script.
Tables
Tables are inserted with a figure include.
Simple tables are included as markdown in markdown="", for example:
{% include figure
 markdown="
| Technology | Number of workers | Coal required (tonnes) | Total cost (£) |
|------------|:-------------------:|:------------------------:|:----------------:|
| B          |                 4 |                      2 |             80 |
| A          |                 1 |                      6 |            130 |
| E          |                10 |                      1 |            120 |

*Wage £10, cost of coal £20 per tonne*
"
 reference="Figure 2.6"
 caption="The cost of using different technologies to produce 100 metres of cloth: Low relative cost of labour."
 description="The cost of using different technologies to produce 100 metres of cloth: Low relative cost of labour."
%}
Complex tables (including those with merged cells) are included in as html in html="", as in this example:
 {% include figure
 html="<table>
  <tr>
 <th>Technology</th>
 <th>Number of workers</th>
 <th>Coal required (tonnes)</th>
 <th>Total cost (£)</th>
  </tr>
  <tr>
 <td colspan='4'>Wage £10, Cost of coal £20 per tonne</td>
  </tr>
  <tr>
 <td>B</td>
 <td>4</td>
 <td>2</td>
 <td>80</td>
  </tr>
  <tr>
 <td colspan='4'>Wage £10, Cost of coal £5 per tonne</td>
  </tr>
  <tr>
 <td>B</td>
 <td>4</td>
 <td>2</td>
 <td>50</td>
  </tr>
  <tr>
 <td>A</td>
 <td>1</td>
 <td>6</td>
 <td>40</td>
  </tr>
</table>"
 reference="Figure 2.8"
 caption="The cost of using different technologies to produce 100 metres of cloth."
 description="At the new relative prices, the B-technology is on the isocost line MN, where the cost is £50. Switching to technology A will be cheaper."
 %}
If you are working from Word or Excel, you will need to create markdown or HTML tables.
To do this:
- go to the Tables Generator website
- select the ‘Markdown Tables’ or ‘HTML Tables’ tab
- select ‘File’, and ‘Paste table data’
- paste in the table and click on ‘Load’ and then ‘Generate’.
This will generate the table for you. If you’re creating an HTML table, tick the ‘Do not generate CSS’ box. Then copy-paste the generated table between the double quote marks of the markdown="" or html="" node of the figure include.
Classes
The following classes can be added to a table:
widealign-leftalign-rightdata-align-right
Refer to Tables in the house style section for guidance on when to apply these classes.
Box features
The CORE projects use many kinds of boxes and box-like features, including:
- Great economists
- When economists disagree
- How economists learn from facts
- Einstein
- Exercise
- Info
- Find out more
- Walk-through
- Concepts introduced
- Extensions
These must be named and tagged consistently.
| Name | Class in markdown | Notes |
|---|---|---|
| Great economists | .great-economist or .great-economists |
|
| When economists disagree | .economist or .economists |
|
| How economists learn from facts | .economist or .economists |
|
| Einstein | .einstein |
|
| Exercise | .exercise |
Exercise boxes can, only if absolutely necessary, be moved to the sidebar in print by adding .pdf-sidebar. |
| Info | .info |
Appears in the sidebar. Can be widened into the text area with .wide. |
| Find out more | .expandable-box |
An expandable box used in ESPP and Doing Economics |
| Walk-through | .expandable-box |
|
| Concepts introduced | .box |
|
| Extension | .expandable-box .extension |
In The Economy 2.0, these replaced the Leibniz feature. Extensions include a preview, with both the content and preview placed within a div. The preview includes a QR code for print. Refer to existing examples when formatting these. |
Box features can be formatted with markdown blockquotes (add > to the start of each line of content) followed by the relevant tag, as shown in the exercise example below:
> ### **Exercise 2.1** Designing a model
>
> For a country (or city) of your choice, look up a map of the railway or public transport network.
>
> Much like economic models, maps are simplified representations of reality. They include relevant information, while abstracting from irrelevant details.
>
> 1. How do you think the designer selected which features of reality to include in the map you have selected?
> 2. In what way is a map not like an economic model?
{:.exercise}
When a box feature includes liquid syntax, such as {% include figure %}, the content must be placed inside an HTML div with the opening tag <div class="" markdown="1"> and the closing tag </div>.
<div class="exercise" markdown="1">
### **Exercise 3.11** Working hours across countries and time
The figure below illustrates what has happened to working hours in many countries during the twentieth century (the UK is in both charts to aid comparison).
{% include figure
images="figure-03-exercise-11.jpg"
description="Working hours throughout the twentieth century"
source="Michael Huberman and Chris Minns. 2007. [‘The times they are not changin’: Days and hours of work in Old and New Worlds, 1870–2000’](https://tinyco.re/2758271){:.show-url}. *Explorations in Economic History* 44 (4): pp. 538–567."
class="fixed"
%}
1. How would you describe what happened?
2. How are the countries in Panel A of the figure different from those in Panel B?
3. What possible explanations can you suggest for why the decline in working hours was greater in some countries than in others?
4. Why do you think that the decline in working hours is faster in most countries in the first half of the century?
5. In recent years, is there any country in which working hours have increased? Why do you think this happened?
</div>
Multiple choice questions
Questions are stored in their own files (for example, question-03-04.md) in the book folder.
These are added to the relevant unit file (for example, 03.md) with an include tag:
{% include question file="question-03-04" %}
A question file should follow the layout of this example:
---
correct: 2
---

### **Question 3.4** Choose the correct answer(s)

[Figure 3.6](03.html#figure-3-6){:.show-page-number} shows Alexei’s indifference curves for free time and final grade. Which of the following is true?

- Alexei prefers C to B because at C he has more free time.
+ Alexei is indifferent between the grade of 84 with 15 hours of free time, and the grade of 50 with 20 hours of free time.
- Alexei prefers D to C, because at D he has the same grade and more free time.
- At G, Alexei is willing to give up 2 hours of free time for 10 extra grade points.
{:.mcq-options}

* The indifference curve through C is lower than that through B. Hence Alexei prefers B to C.
* A, where Alexei has the grade of 84 and 15 hours of free time, and D, where Alexei has the grade of 50 with 20 hours of free time, are on
the same indifference curve.
* At D Alexei has the same amount of free time but a higher grade.
* The opposite trade-off is true: going from G to D, Alexei is willing to give up 10 grade points for 2 extra hours of free time. Going from G to E, he is willing to give up 2 hours of free time for 15 extra grade points.
{:.mcq-feedback}
If there is more than one correct answer, then the file frontmatter will list both, for example:
---
correct: 2, 4
---
The list of answer options has the class .mcq-options.
The list of feedback, in order to relate to the answer options, has the class .mcq-feedback.
If you have a regular list, too, immediately before one of these lists, separate it with a ^, as shown below. This symbol is a kramdown end-of-block marker. It tells kramdown the two lists above and below it are not one list.
---
correct: 2
---

### **Question 3.4** Choose the correct answer(s)

[Figure 3.6](03.html#figure-3-6){:.show-page-number} shows Alexei’s indifference curves for free time and final grade. Which of the following is true?

* list item one
* list item two
* list item three
^
- Alexei prefers C to B because at C he has more free time.
+ Alexei is indifferent between the grade of 84 with 15 hours of free time, and the grade of 50 with 20 hours of free time.
- Alexei prefers D to C, because at D he has the same grade and more free time.
- At G, Alexei is willing to give up 2 hours of free time for 10 extra grade points.
{:.mcq-options}

* The indifference curve through C is lower than that through B. Hence Alexei prefers B to C.
* A, where Alexei has the grade of 84 and 15 hours of free time, and D, where Alexei has the grade of 50 with 20 hours of free time, are on
the same indifference curve.
* At D Alexei has the same amount of free time but a higher grade.
* The opposite trade-off is true: going from G to D, Alexei is willing to give up 10 grade points for 2 extra hours of free time. Going from G to E, he is willing to give up 2 hours of free time for 15 extra grade points.
{:.mcq-feedback}
Glossary page and the definition feature
Glossary page
The book’s glossary is stored in a YAML file (glossary.yml) in the _data folder.
In V1 repositories, glossaries for translations are saved in a subfolder named after the language code, for example, _data/fr/glossary.yml for the French glossary.
In V2 repositories the file is placed within each of the relevant book, volume, or translation subfolders of _data/works.
To include the entire glossary on a page, use this tag in the markdown:
{% include glossary %}
Creating YAML files from spreadsheets
If you need to create a glossary from an existing spreadsheet and you’re set up to work in an offline text editor such as Visual Studio Code, follow these steps. Alternatively, contact EBW for assistance.
- Copy all of and only the cells containing terms, definitions, and references.
- Open a new document in your code editor (these steps refer to Visual Studio Code) and make sure ‘Indent with Spaces’ is not selected (bottom right). You want tabs.
- Paste into the new document.
- Search for double quote marks
"and replace with singles'. Do this manually, case by case, because you’re also looking for instances where an entire definition is enclosed unnecessarily with quote marks, which you don’t want; you can remove those quote marks. - Replace all tabs with two double quote marks:
"" - Turn off word wrap and, using multiple cursors, add this at the start of each line:
- term: " -
Run this regex (find, replace):
- term: "(.+?)""(.*?)""(.*)- term: "$1"\n definition: "$2"\n cross-reference: "$3" - Paste everything into yamllint.com to check that it’s valid.
- Paste that into
glossary.yml.
Definition feature
Defined key terms are included in CORE projects, as they are introduced within the text. The conventions for the inclusion of these terms are set out in the house style.
A glossary definition can be included in a unit’s markdown file in two ways:
- for print output, use the liquid tag
{% include definition term="" %}on the line above the paragraph with the term being glossed. This shows in the print sidebar (margin). - for web and app output, use the kramdown tag
{:data-term=""}directly after the term being glossed (no space). This creates a ‘pop up’ when users click on the term.
These tags fetch the definition from the glossary.yml file. Here’s an example for the term ‘gross domestic product (GDP)’:
{% include definition term="gross domestic product (GDP)" %}

The estimate of living standards that we used in [Figure 1.1a](#figure-1-1a) (GDP per capita) is a measure of the total goods and services produced in a country (called **gross domestic product**{:data-term="gross domestic product (GDP)"}, or **GDP**{:data-term="gross domestic product (GDP)"}), which is then divided by the country’s population.
Glossary definitions are included correctly when:
- The
glossary.ymlfile uses valid YAML (see the YAML syntax section of the Electric Book template. - The term in quotes matches the term in the
glossary.ymlfile exactly (it is case, space, and spelling sensitive).
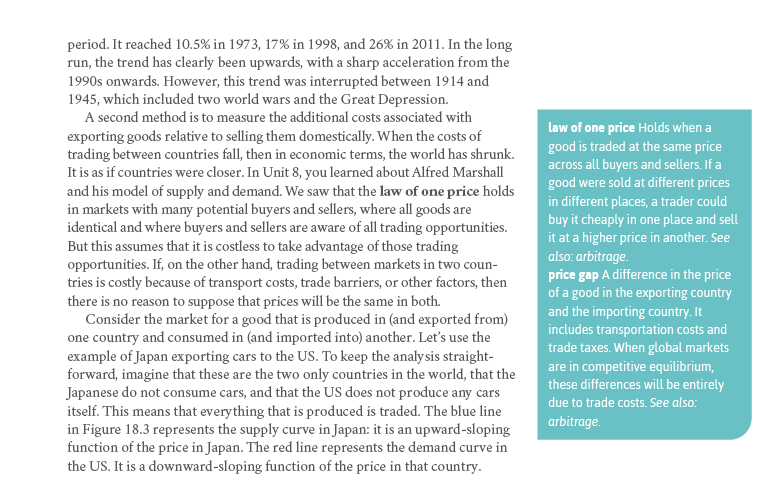
Multiple glossary terms can be included within one box in the sidebar of print books by using one tag separated by a vertical bar:
{% include definition term="law of one price | price gap" %}
This tag includes “law of one price” and “price gap” to produce this in print:
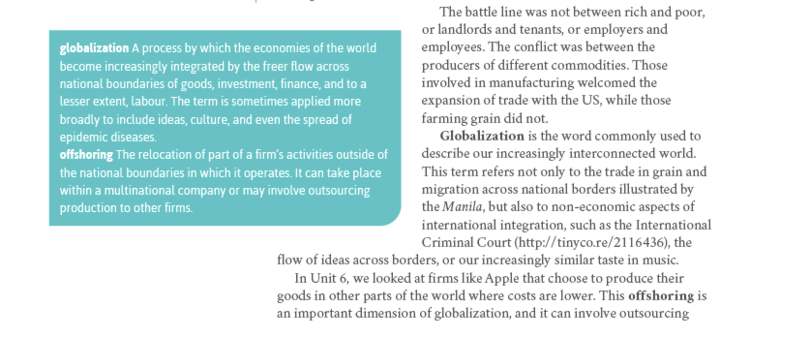
We can also add classes to the tag, we can widen a glossary box, for example, by adding a class="wide" inside the liquid tag like this:
{% include definition term="globalization | offshoring" class="wide" %}
Which will produce this in print:
Note
Print caveat: Given that the glossary include is a sidebar element which attaches to a paragraph that it sits above, if there is no space in the sidebar for the glossary box to sit, the body-text paragraph it is attached to will not be able to sit on that page either. Consequently you will have an unwanted blank space. Fortunately, careful placement of sidebar elements can usually prevent this.
Bibliography, references, and footnotes
The book’s glossary is stored in a YAML file (bibliography.yml) in the _data folder.
In V1 repositories, glossaries for translations are saved in a subfolder named after the language code, for example, _data/fr/bibliography.yml for the French bibliography.
In V2 repositories, the file is placed within each of the relevant book, volume, or translation subfolders of _data/works.
By storing references in one file, we can standardize reference style, avoid duplicate references, and monitor the occurrence of references across all units.
In the print book and on the web, references are included:
- for a unit, at the end of the unit, with the liquid tag
{% include bibliography unit="x" %}(wherexis the unit number) - for the book or volume, at the end of the book or volume, with the liquid tag
{% include bibliography unit="bibliography" %}in thexx-xx-bibliography.mdfile.
The bibliography.yml file uses YAML syntax (which you can validate here).
An entry looks like this:
- reference: "Ackerman, Frank. 2007. [‘Debating climate economics: the Stern Review vs its critics’](https://tinyco.re/6591851){:.show-url}. Report to Friends of the Earth, July 2007."
  units:
 - "20"
The reference ‘cascades’ such that following a hyphen and reference: the reference is included in double quotes (consequently any quotes required in the reference itself should be single quotes, or Unicode curly double quotes).
Under the reference comes units: and under that a hyphen followed by the unit which the reference applies to in double quotes. If the reference applies to Units 19, 20 and 21, we would use:
  - reference: "Ackerman, Frank. 2007. [‘Debating climate economics: the Stern Review vs. its critics’](https://tinyco.re/6591851){:.show-url}. Report to Friends of the Earth, July 2007."
 units:
   - "19"
   - "20"
   - "21"
The units specified in each entry in bibliography.yml say which units this reference applies to. Then, when we use the bibliography include tag at the end of a unit (usually following a heading like ## 8.12 References) that tag fetches all of the references specified for that unit and includes them.
So the tag to output only the bibliography for Unit 18 is:
{% include bibliography unit="18" %}
Footnotes in the sidebar and as pop-ups
Some references only appear as footnotes, not in the bibliography. See the house style for references and citations for guidance.
Footnotes appear in the sidebar in print and as pop-ups on screen (repeated as a list at the end of the page).
Apply a numbered tag, for example, [^1], to the end of a sentence or paragraph to which a footnote applies. Then include the reference after a matching tag [^1]: below the paragraph, like this:
GDP measures the output of the economy in a given period, such as a year. Diane Coyle, an economist, says it 'adds up everything from nails to toothbrushes, tractors, shoes, haircuts, management consultancy, street cleaning, yoga teaching, plates, bandages, books, and the millions of other services and products in the economy'.[^1]

[^1]: Diane Coyle. 2014. *GDP: A Brief but Affectionate History*. Princeton, NJ: Princeton University Press.
In the above example, the first line is the body text with a footnote added inline, and the last line includes the footnote reference.
Each footnote within a unit should have a distinct number, and the number within the inline and reference tags should match.
Sidenotes
See the guidance in the feature set section when including content as a sidenote.
Here is an example of sidenote formatting:
> Listen to Diane Coyle talking about the [benefits and limitations of measuring GDP](https://tinyco.re/1216717){:.show-url}.
{:.sidenote}

GDP measures the output of the economy in a given period, such as a year. Diane Coyle, an economist, says it 'adds up everything from nails to toothbrushes, tractors, shoes, haircuts, management consultancy, street cleaning, yoga teaching, plates, bandages, books, and the millions of other services and products in the economy'.
Sidenotes can be widened into the text area to improve layout with .wide, web-wide or web-full-width classes.
Videos
CORE projects often include videos.
To include these, use the liquid tag {% include video %}. For example:
{% include video
    host="youtube"
    class="economist-in-action"
    id="KMHaT_WUF54"
    image="youtube-KMHaT_WUF54.jpg"
    link="https://tinyco.re/9574839"
    title="Thomas Piketty and James Heckman: Why economics needs data"
    description="In our 'Economist in action' video, Thomas Piketty and James Heckman discuss how tax records and other data can be used to provide a social context for our understanding of economics. They argue that this context can create a more detailed narrative for understanding today’s economic challenges. "
    options="
* [Bilibili](https://www.bilibili.com/video/BV11V41127ts)
* [Download](https://d18y50suo8qxjg.cloudfront.net/downloads/piketty-and-heckman_why-economics-needs-data.mp4)
* [View transcript](transcript-piketty-and-heckman_why-economics-needs-data.html)"
%}
- The
hostspecifies the website that the video is hosted on. Only YouTube or Vimeo videos can be embedded. - The
classapplies to CORE’s ‘Economist in action’ videos only. When including other videos, this parameter can be excluded. - The
idis the string (usually about 11 characters) that YouTube and Vimeo use to identify the video. It’s in the URL for the video, after the?v=portion of the link. - The
imageis the image which will appear in the print and epub versions of the book. Take a screenshot of the video at a suitable point and specify the filename in this field. - The
linkis the URL that a user should enter into their browser to see the video. For print, this is a shortened, tinyco.re link. - The
titleanddescriptionare like a caption (the text which appears alongside the screenshot in the book). This might be the same text that appears on YouTube, below the video. - The
optionsrefer to the ‘Other video options’ dropdown menu that appears below videos on the web. Each list item in the options parameter is a separate, clickable link in the dropdown menu. The text in square brackets, for example,[Download]is what will be visible to the user. To disable this menu entirely, changeoptionstooptions-disabledand it will not appear on the website. This is usually done when transcripts are still being finalized.
By default, this include will place a thumbnail and link in the sidebar in print. On the web it will show in the main text. To place the video in the sidebar on the web, add the class thumbnail.
Index
Traditionally, the indexer works from the book’s final layout, and notes page numbers for each concept manually. But in CORE projects, where we reflow content into different formats, page numbers are never really fixed. And in epub, web and app formats, they don’t exist at all.
We use a dynamic index where each ‘page number’ is actually a link to a particular point in the book. This way the index can be used by readers of the book in all formats, not just the PDF, and it is dynamically updated when content shifts.
Refer to the guidelines within the Electric Book template documentation for tagging indexed concepts and formatting the index list.
Creating and exporting figure images
There are two ways to create figure images for CORE publications, depending on the nature of the content.
Figures based on real-world data (‘data figures’) are created using an automated, R-based system, and all other figures (‘non-data figures’), such as worked examples or flowcharts, are created manually in Adobe Illustrator.
All CORE projects, with the exception of this documentation, store image files within a dedicated media repository, as specified in the list of repositories. If you are a technical user, contact EBW for repository access, and guidelines for adding, optimizing and serving images within media repositories.
Creating automated figures
Automated data figures are created using R scripts and YAML files that are maintained in the CORE figure automation repository. This system uses the latest data, managed in the Google Drive data folder, each time the SVG is generated. Contact the EBW project lead for access to this repository and Google Drive folder.
If you need to create new or updated figure scripts, EBW can provide guidance on the script-creation process.
The text for the automated charts is stored in image strings. These YAML files contain all translations of a given figure. Each language is kept within its relevant language node, for example:
en:
  y-axis-label:
	text: "GDP per capita"
  x-axis-label:
	text: "Year"
  graph-legend-item-1:
	text: "Britain"
pt:
  y-axis-label:
	text: "PIB per capita"
  x-axis-label:
	text: "Ano"
  graph-legend-item-1:
	text: "Grã-Bretanha"
fi:
  y-axis-label:
	text: "Bkt asukasta kohti"
  x-axis-label:
	text: "Vuosi"
  graph-legend-item-1:
	text: "Iso-Britannia"
The number styles, namely decimal indicators and thousand separators, are set globally for each language.
Adjusting text placement
To adjust the placement of text on the charts, ‘nudges’ can be added to the image strings to move the text vertically, horizontally, or both, for example:
en:
  y-axis-label:
 text: "GDP per capita"
 y_nudge: 0.8
  x-axis-label:
 text: "Year"
  graph-legend-item-1:
 text: "Britain"
 x_nudge: -0.1
 y_nudge: 0.6
Exporting automated figures as SVGs
Should you need to export automated figures as SVGs, contact EBW for access to the repository, details on how to get set up for this process, and export guidelines.
Creating manual figures
Manual, non-data figures are created in Adobe Illustrator in the CORE artwork style.
Exporting manual figures as SVGs
- Make sure the artboards in the artboards panel are listed in the same order as the artboards themselves. Click and drag in the artboards panel to reorder the list. This does not affect the actual placement or order of artboards or artwork on them on the pasteboard.
- Rename the artboards in the artboards panel as a, b, c, and so forth. (that is, the letter used in the figure reference for that image).
- Save your Illustrator file before exporting to SVG. This is crucial as exporting the SVG will overwrite any unsaved changes to the Illustrator file.
- File > Save as …
- Save as type ‘.SVG’ and tick ‘Use artboards’. Leave range as ‘All’. Click ‘Save’.
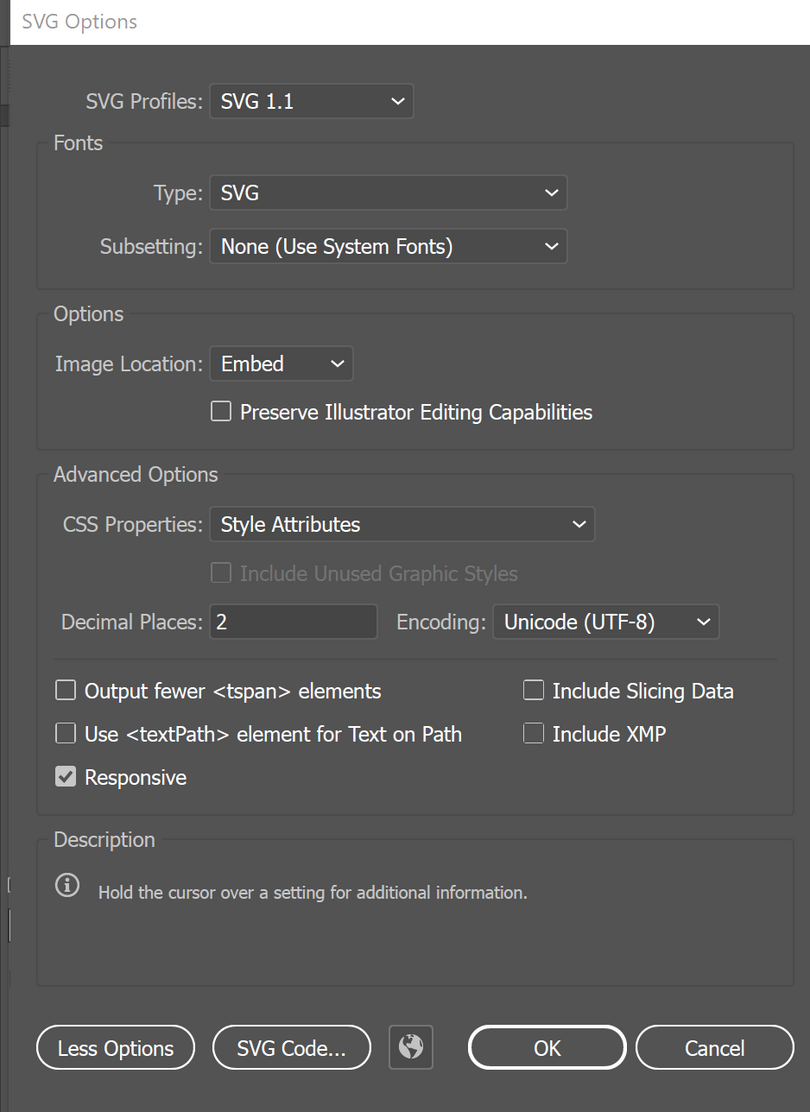
- Adjust the SVG Options settings:
- SVG Profiles: SVG 1.1
- Fonts:
- Type: SVG
- Subsetting: None (Use System Fonts)
- Options
- Image Location: Embed
- Leave the ‘Preserve Illustrator Editing Capabilities’ box unticked.
- Advanced Options:
- CSS Properties: Style Attributes
- Decimal Places: 2
- Encoding: Unicode (UTF-8)
- Untick all boxes except for ‘Responsive’ and ‘Output fewer
<tspan>elements’. Click ‘OK’.
- Untick all boxes except for ‘Responsive’ and ‘Output fewer
- For multiple artboards:
- Each artboard will land as a separate SVG, saved for example as ‘figure-01-01_a.svg.` The underscore preceding the artboard indicator must be changed to a hyphen.
- In Finder on Mac, select all the exported JPGs, right-click, and select ‘Rename …’. The dialog lets you replace all underscores with hyphens.
- There isn’t a way to batch rename files on Windows, but you can use the Tab key to cycle through the filenames as you rename them.
For single artboards: rename the file to remove the artboard indicator.
- Each artboard will land as a separate SVG, saved for example as ‘figure-01-01_a.svg.` The underscore preceding the artboard indicator must be changed to a hyphen.
Images
Ornamental images or photographs intended to fill the main text column and retain their font sizes must be 1280px wide, or 2160px wide if they also fill the sidebar area in print.
If they must fill the full width of the page (for example, chapter openers), they must be at least 2500px wide.
Including images, figures, and slidelines
Images
Any image that does not need a caption is inserted with this syntax:
{% include figure
   images="filename.jpg"
   alt-text="A description of the image"
%}
This syntax is used for the images within .great-economist boxes. These images also get a .thumbnail and .no-fullscreen class, as shown below:
{% include figure
    image="01-adam-smith.jpg"
    class="thumbnail no-fullscreen"
    alt-text="Portrait of Adam Smith"
%}
Figures
A figure is an image with a figure reference and caption, but it can be much more. To include a figure, start with this simple tag:
{% include figure %}
Then, inside that tag after the word figure, add extra info, depending what you need it to include. Here is a figure include with each possible parameter. You can copy this and set the value in each relevant parameter, removing unused parameters.
{% include figure
   images=""
   html=""
   markdown=""
   reference=""
   link=""
   caption=""
   title=""
   description=""
   alt-text""
   source=""
   class=""
   more=""
   more-link-text=""
%}
Within the quotes " ", we can define the following information:
- one or more images (for example,
figure-01-01.svg). Filenames must include the file extension, and be all lowercase, using hyphens for separation, and shouldn’t include any spaces or other punctuation. - html (for example, for complex tables)
- markdown (for example, for simple tables)
- a reference (for example,
Figure 1.1). These must be unique, and should match the filename included in theimagesfield. - a link (clicking the image opens this link)
- a caption (appears below the image)
- a title (appears in online slidelines above the description)
- a description (appears in online slidelines)
- alt text is required for all figures, except standalone tables and ornamental images (see the alt text guidelines for more detail)
- a source (appears below the figure)
- a class adjusts the default layout of the figure
- a link to more info on the figure, such as a version of the figure on Our World in Data. If this is just a URL, it will be a button on the web. Always use tinyco.re links.
- optionally,
more-link-text, which overrides the default text that automatically displays on themorebutton on screen and as text in PDF.
If you need to add more than one ‘more’ link button, you can enter multiple links separated with a |, with no spaces. And you can create custom button-wording for each link by separating your more-link-text with |s, too. For example:
   more="https://tinyco.re/2841924|https://tinyco.re/2684283"
   more-link-text="View UK data at OWiD|View US data at OWiD"
Note
Figure includes rely on the double quotes as parameter markers. If the text you’re adding to a parameter contains quotes, you’d use single quotes in the text, or vice versa. Do not mix single and double quotes, or the software won’t know where the parameter ends. If you must use, say, double quotes inside the quotes around a parameter, use Unicode glyphs for curly quotes,
“and”. For instance, all of these are okay:caption="Mention of the word 'capitalism' in New York Times articles'" caption='Mention of the word "capitalism" in New York Times articles.' caption="Mention of the word “capitalism” in New York Times articles."
Here’s an example of a complete figure include from The Economy 2.0: Microeconomics:
{% include figure
    image="figure-01-02-a.svg"
    reference="Figure 1.2a"
    caption="Carbon dioxide in the atmosphere (1010–2020) and global carbon emissions from burning fossil fuels (1750–2018)."
    alt-text="There are 2 line charts. In line chart 1, the horizontal axis shows years from 1000 to 2020. The vertical axis shows atmospheric CO 2 in parts per million, and ranges from 250 to 450.  Between 1010 and 1800, atmospheric C O 2 was fluctuating around 280 parts per millions. It increased to slightly above 400 parts per million between 1800 and 2020. In line chart 2, the horizontal axis shows years from 1000 to 2020. The vertical axis shows global carbon emissions from fossil-fuel burning in millions of metric tonnes, and ranges from 0 to 40,000, with each increment going up by 8000. Data for carbon emissions is only available from 1750. Carbon emissions increased significantly from almost 0 millions of metric tonnes in 1750 to almost 40,000 millions of metric tonnes in 2018."
    source="Pierre Friedlingstein, Matthew W. Jones, Michael O’Sullivan, et al. 2019. [‘Global Carbon Budget 2019’](https://tinyco.re/2898770){:.show-url}. *Earth System Science Data* 11: pp. 1783–1838. doi: 10.5194/essd-11-1783-2019.; Pieter Tans NOAA/GML and Ralph Keeling, Scripps Institution of Oceanography. 2022. [‘Trends in Atmospheric Carbon Dioxide’](https://tinyco.re/4421890){:.show-url}.; D. Gilfillan, G. Marland, T. Boden, and R. Andres, R. 2021. [‘Global, Regional, and National Fossil Fuel CO2 Emissions’](https://tinyco.re/3338780){:.show-url}. Carbon Dioxide Information Analysis Center (CDIAC) Datasets. Accessed: September, 2021."
    class="float-top"
%}
A figure include is correct when:
- the reference matches the filename (but for the file extension, case, spaces and unnecessary zeros, not needed within the reference)
- each
reference=""in a particular.mdfile is unique - the filename in
images=""matches the filename in the repository, and the filename includes the file extension, is lowercase, uses hyphens for separation, and doesn’t include any spaces or other punctuation - the
caption=""has been provided (and for slidelines, thetitleanddescription) - The empty parameters have been removed, as there are rare occasions where using an empty parameter can affect layout.
Note
It is critical that figure
references are unique in each file.These become
ids in the output HTML, andids must be unique in an HTML document. This is also required for the slides Javascript to work, because when a user clicks on a slide thumbnail, the uniqueidtells the script what image to show.
Slidelines
CORE projects use slidelines (sets of multiple figures) to explain complex figures step by step.
Slidelines use the same syntax as figures, except:
- each slide also has a title
title="" - the
class="summary"must be added to the first figure in a slideline. This is the figure that is included in the print edition in full. The other slides, in print, are represented only by their title and description. - the
description=""text displays after the figure reference (instead of the caption in standard figures).
In markdown, we create a slideline by grouping a sequence of figures in a div. Before the first figure add
<div class="slides">
and after the last figure add
</div>
Troubleshooting
In print, when there are four slides, there is a chance they fall into the first two columns, leaving the third blank. We can only control for this manually, adding a column-break-after class to one of the figures in slides. In the include parameters, add class="column-break-after".
Galleries
CORE projects use image galleries on pages such as ‘Producing The Economy’. These galleries are populated from data stored in people.yml.
Larger galleries can be centred on web output using the class team-gallery-center-web.
In print, team galleries do not span columns or float to the top of the next page by default. You need to add the pdf-span-columns and/or float-top-next classes to get this behaviour.
Here is an example of a team-gallery include:
{% include team-gallery team="Authors" class="team-gallery-center-web float-top-next" %}
If necessary, you can create separate small galleries for page refinement purposes. To do this, you can limit which people show in a given gallery by adding an images parameter. We use images because that’s the only thing guaranteed to be unique among all people in people.yml. To display people’s roles in a gallery, you add a roles=true parameter to the include tag:
{% include team-gallery team="Spanish production" images="ebw-arthur-attwell.jpg, ebw-lauren-ellwood.jpg" roles=true %}
Print refinement
The Electric Book Workflow automates 80% of a traditional typesetter’s role by producing a PDF using CSS rules and Kramdown-markdown tags. For this reason, it’s not necessary to manually place each element (the CSS styles will automate placement based on clever rules and available space) but some manual refinement is usually necessary to improve the automated page layout.
The most commonly used classes for print refinement are included in the classes section. Contact EBW for more detailed guidelines.
